Rumah >pembangunan bahagian belakang >Tutorial Python >python读取excel数据绘图的实例详解
python读取excel数据绘图的实例详解
- 零下一度asal
- 2017-06-25 09:54:2810541semak imbas
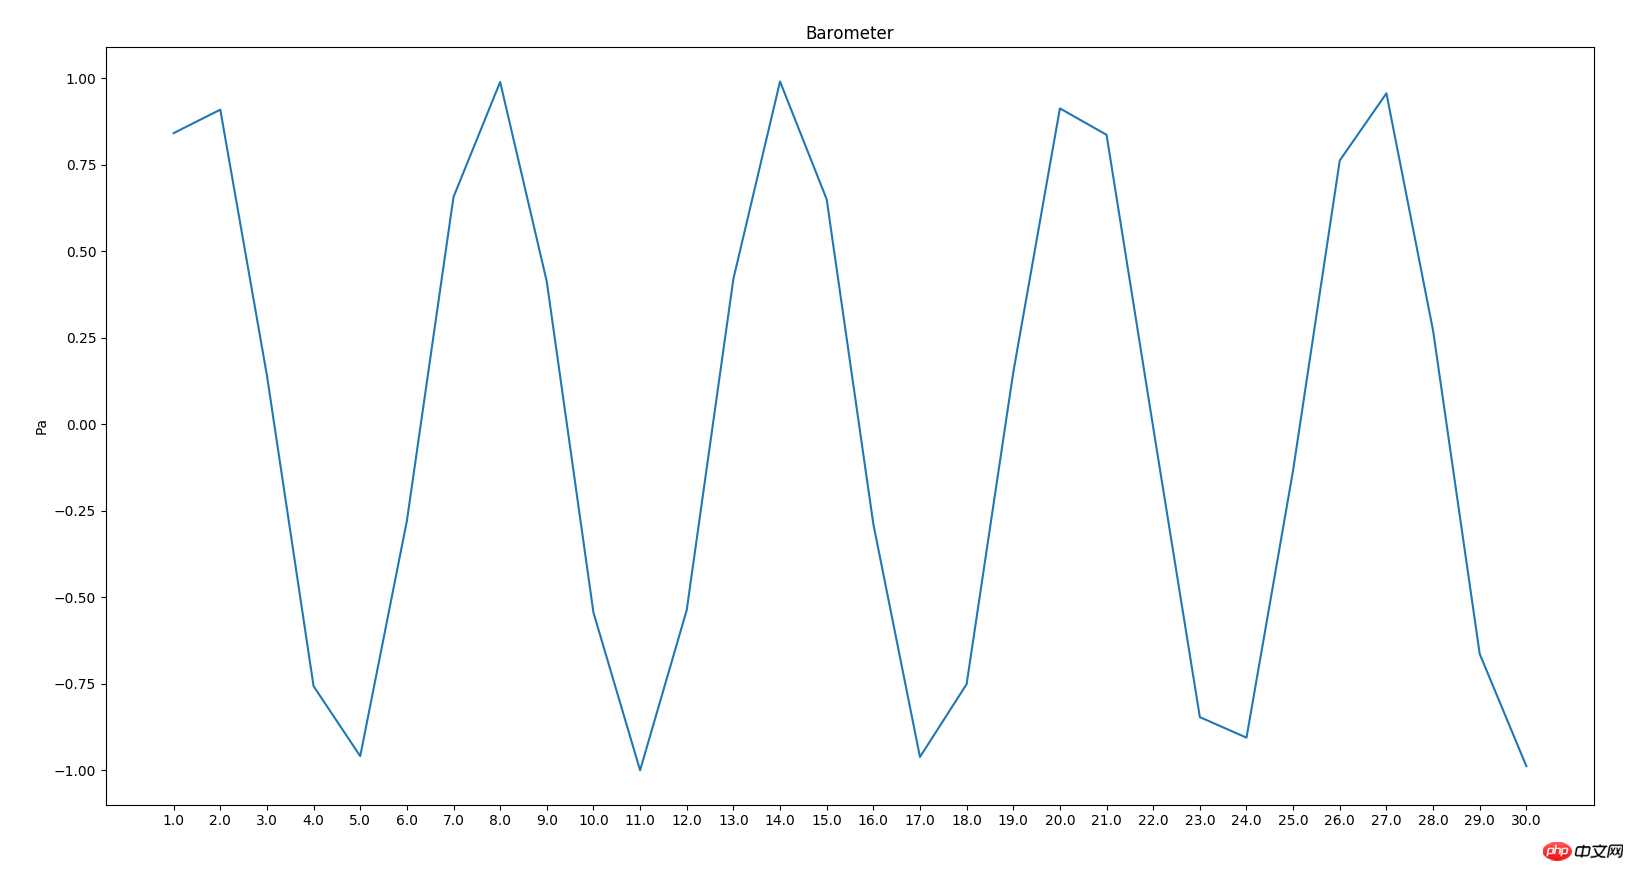
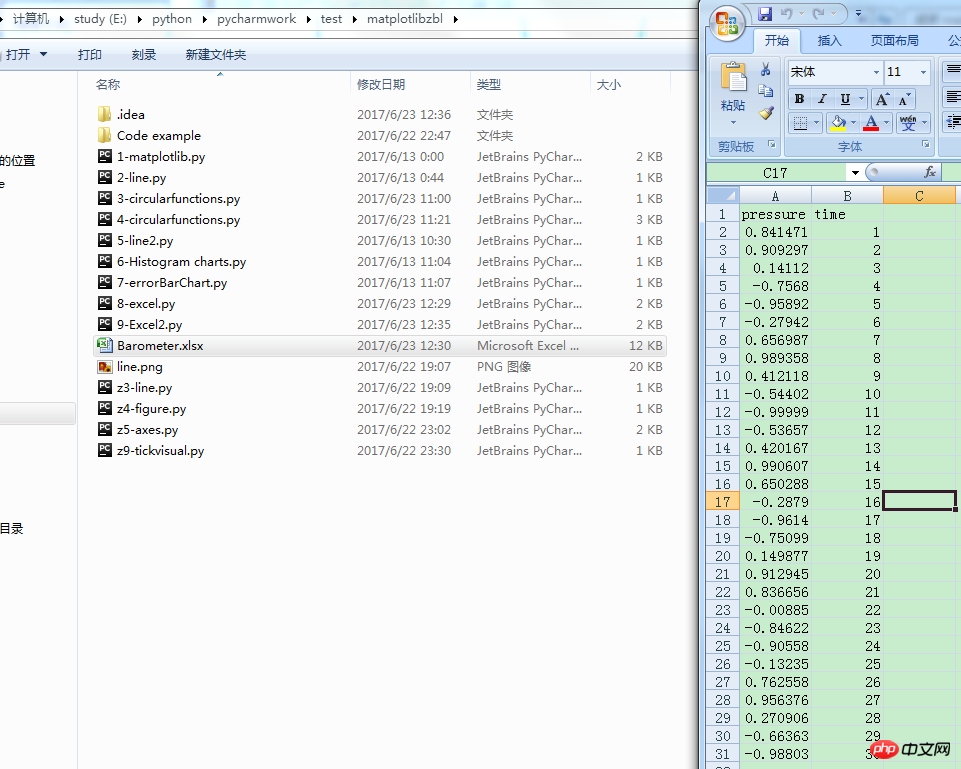
1 #!/usr/bin/env python 2 # -*- coding:utf-8 -*- 3 # __author__ = "blzhu" 4 """ 5 python study 6 Date:2017 7 """ 8 # coding=utf-8 9 #######################################################10 # filename:xlrd_draw.py11 # author:12 # date:xxxx-xx-xx13 # function:读excel文件中的数据14 #######################################################15 import numpy as np16 import matplotlib.pyplot as plt17 import xlrd18 19 # 打开一个workbook20 workbook = xlrd.open_workbook(r'E:\python\pycharmwork\test\matplotlibzbl\Barometer.xlsx')21 22 # 抓取所有sheet页的名称23 worksheets = workbook.sheet_names()24 print('worksheets is %s' % worksheets)25 26 # 定位到mySheet27 mySheet = workbook.sheet_by_name(u'Pressure')28 29 # get datas30 pressure = mySheet.col_values(0)31 print(pressure)32 time = mySheet.col(1)33 print('time1',time)34 time = [x.value for x in time]35 print('time2',time)36 37 38 # drop the 1st line of the data, which is the name of the data.39 pressure.pop(0)40 time.pop(0)41 42 # declare a figure object to plot43 fig = plt.figure(1)44 45 # plot pressure46 plt.plot(time,pressure)47 48 plt.title('Barometer')49 plt.ylabel('Pa')50 plt.xticks(range(len(time)),time)51 plt.show()

参考:
学习python好去处:
Atas ialah kandungan terperinci python读取excel数据绘图的实例详解. Untuk maklumat lanjut, sila ikut artikel berkaitan lain di laman web China PHP!
Kenyataan:
Kandungan artikel ini disumbangkan secara sukarela oleh netizen, dan hak cipta adalah milik pengarang asal. Laman web ini tidak memikul tanggungjawab undang-undang yang sepadan. Jika anda menemui sebarang kandungan yang disyaki plagiarisme atau pelanggaran, sila hubungi admin@php.cn
Artikel sebelumnya:Pytho 中闭包与装饰器详解Artikel seterusnya:Django 在Python3.5 下报 没有模块MySQLdb的解决方法

