Rumah >hujung hadapan web >tutorial js >JavaScript可视化图表库MetricsGraphics.js的详情介绍
JavaScript可视化图表库MetricsGraphics.js的详情介绍
- 黄舟asal
- 2017-03-15 17:32:242288semak imbas
JavaScript可视化图表库MetricsGraphics.js的详情介绍
MetricsGraphics.js也是一款基于JavaScript的响应式图表库,和Chartist.js类似,MetricsGraphics.js同样支持几乎所有类型的图表,包括折线图、柱形图、饼图等。同时MetricsGraphics.js是基于可视化图表库D3上面的,因此开发者可以自定义很多功能强大的图表功能。
MetricsGraphics.js的使用方法
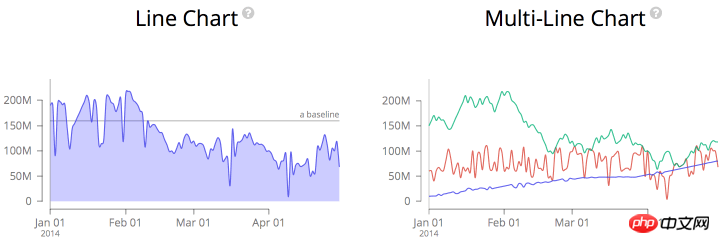
先来看看效果图:


JavaScript代码:
MG.data_graphic({
    title: "Downloads",
    description: "This graphic shows a time-series of downloads.",
    data: [{'date':new Date('2014-11-01'),'value':12},
           {'date':new Date('2014-11-02'),'value':18}],
    width: 600,
    height: 250,
    target: '#downloads',
    x_accessor: 'date',
    y_accessor: 'value',
})
MetricsGraphics.js的整体效果还不错,就是有些资源需要翻*墙才能正常使用,不过你也可以下载源代码来试试。
Atas ialah kandungan terperinci JavaScript可视化图表库MetricsGraphics.js的详情介绍. Untuk maklumat lanjut, sila ikut artikel berkaitan lain di laman web China PHP!
Kenyataan:
Kandungan artikel ini disumbangkan secara sukarela oleh netizen, dan hak cipta adalah milik pengarang asal. Laman web ini tidak memikul tanggungjawab undang-undang yang sepadan. Jika anda menemui sebarang kandungan yang disyaki plagiarisme atau pelanggaran, sila hubungi admin@php.cn
Artikel sebelumnya:在Swift中使用JavaScript的方法和技巧详细介绍Artikel seterusnya:详细介绍强大的JavaScript响应式图表Chartist.js(图文)
Artikel berkaitan
Lihat lagi- Analisis mendalam bagi komponen kumpulan senarai Bootstrap
- Penjelasan terperinci tentang fungsi JavaScript kari
- Contoh lengkap penjanaan kata laluan JS dan pengesanan kekuatan (dengan muat turun kod sumber demo)
- Angularjs menyepadukan UI WeChat (weui)
- Cara cepat bertukar antara Cina Tradisional dan Cina Ringkas dengan JavaScript dan helah untuk tapak web menyokong pertukaran antara kemahiran_javascript Cina Ringkas dan Tradisional

