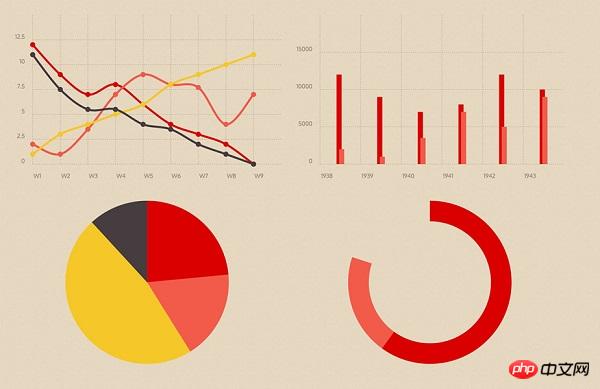
强大的JavaScript响应式图表Chartist.js
Chartist.js是一个非常简单而且实用的JavaScript前端图表生成器,它支持SVG格式,图表数据转换十分灵活,同时也支持多种图表展现形式,不失为一款前端开发者的开发利器。
Chartist.js的特点
配置十分简单,可以很方便地转换各种图表数据格式。
CSS和JavaScript分离,因此代码比较简洁,使用就相对方便。
使用SVG格式,因此Chartist.js可以很灵活的在Web页面上应用。
响应式图表,支持不同的浏览器尺寸和分辨率。
支持自定义 SASS 架构。

Chartist.js的使用方法
首先你需要在其官方网站中下载JS包和CSS包,并且在页面中引用它们:
<link rel="stylesheet" href="bower_components/chartist/dist/chartist.min.css">
<script src="bower_components/chartist/dist/chartist.min.js">
下面我们对一些常用的图表类型做一个简单的介绍。
带Tooltip提示的线形图
效果图:

JavaScript代码:
new Chartist.Line('.ct-chart', {
labels: ['1', '2', '3', '4', '5', '6'],
series: [
{
name: 'Fibonacci sequence',
data: [1, 2, 3, 5, 8, 13]
},
{
name: 'Golden section',
data: [1, 1.618, 2.618, 4.236, 6.854, 11.09]
}
]
});
var easeOutQuad = function (x, t, b, c, d) {
return -c * (t /= d) * (t - 2) + b;
};
var $chart = $('.ct-chart');
var $toolTip = $chart
.append('<p class="tooltip"></p>')
.find('.tooltip')
.hide();
$chart.on('mouseenter', '.ct-point', function() {
var $point = $(this),
value = $point.attr('ct:value'),
seriesName = $point.parent().attr('ct:series-name');
$point.animate({'stroke-width': '50px'}, 300, easeOutQuad);
$toolTip.html(seriesName + '<br>' + value).show();
});
$chart.on('mouseleave', '.ct-point', function() {
var $point = $(this);
$point.animate({'stroke-width': '20px'}, 300, easeOutQuad);
$toolTip.hide();
});
$chart.on('mousemove', function(event) {
$toolTip.css({
left: (event.offsetX || event.originalEvent.layerX) - $toolTip.width() / 2 - 10,
top: (event.offsetY || event.originalEvent.layerY) - $toolTip.height() - 40
});
});多维度的柱形图
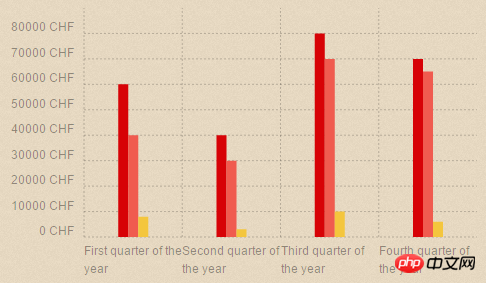
效果图:

JavaScript代码:
new Chartist.Bar('.ct-chart', {
  labels: ['First quarter of the year', 'Second quarter of the year', 'Third quarter of the year', 'Fourth quarter of the year'],
  series: [
    [60000, 40000, 80000, 70000],
    [40000, 30000, 70000, 65000],
    [8000, 3000, 10000, 6000]
  ]
}, {
  seriesBarDistance: 10,
  axisX: {
    offset: 60
  },
  axisY: {
    offset: 80,
    labelInterpolationFnc: function(value) {
      return value + ' CHF'
    },
    scaleMinSpace: 15
  }
});
简单的饼图
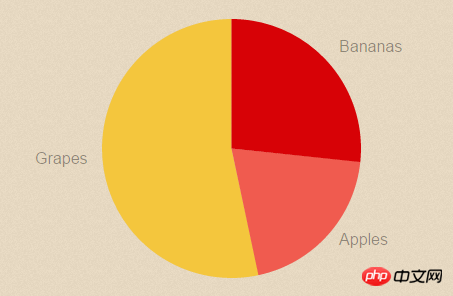
效果图:

JavaScript代码:
var data = {
  labels: ['Bananas', 'Apples', 'Grapes'],
  series: [20, 15, 40]
};

var options = {
  labelInterpolationFnc: function(value) {
    return value[0]
  }
};

var responsiveOptions = [
  ['screen and (min-width: 640px)', {
    chartPadding: 30,
    labelOffset: 100,
    labelDirection: 'explode',
    labelInterpolationFnc: function(value) {
      return value;
    }
  }],
  ['screen and (min-width: 1024px)', {
    labelOffset: 80,
    chartPadding: 20
  }]
];

new Chartist.Pie('.ct-chart', data, options, responsiveOptions);更多关于Chartist.js的用法,可以前往其官方网站进行查阅,包括详细地API。
Atas ialah kandungan terperinci 详细介绍强大的JavaScript响应式图表Chartist.js(图文). Untuk maklumat lanjut, sila ikut artikel berkaitan lain di laman web China PHP!
 Di sebalik tabir: Apa bahasa JavaScript?Apr 28, 2025 am 12:01 AM
JavaScript berjalan dalam penyemak imbas dan persekitaran Node.js dan bergantung pada enjin JavaScript untuk menghuraikan dan melaksanakan kod. 1) menjana pokok sintaks abstrak (AST) di peringkat parsing; 2) menukar AST ke bytecode atau kod mesin dalam peringkat penyusunan; 3) Laksanakan kod yang disusun dalam peringkat pelaksanaan.
 Masa Depan Python dan JavaScript: Trend dan RamalanApr 27, 2025 am 12:21 AM
Trend masa depan Python dan JavaScript termasuk: 1. Kedua -duanya akan terus mengembangkan senario aplikasi dalam bidang masing -masing dan membuat lebih banyak penemuan dalam prestasi.
 Python vs JavaScript: Persekitaran dan Alat PembangunanApr 26, 2025 am 12:09 AM
Kedua -dua pilihan Python dan JavaScript dalam persekitaran pembangunan adalah penting. 1) Persekitaran pembangunan Python termasuk Pycharm, Jupyternotebook dan Anaconda, yang sesuai untuk sains data dan prototaip cepat. 2) Persekitaran pembangunan JavaScript termasuk node.js, vscode dan webpack, yang sesuai untuk pembangunan front-end dan back-end. Memilih alat yang betul mengikut keperluan projek dapat meningkatkan kecekapan pembangunan dan kadar kejayaan projek.
 Adakah JavaScript ditulis dalam C? Memeriksa buktiApr 25, 2025 am 12:15 AM
Ya, teras enjin JavaScript ditulis dalam C. 1) Bahasa C menyediakan prestasi yang efisien dan kawalan asas, yang sesuai untuk pembangunan enjin JavaScript. 2) Mengambil enjin V8 sebagai contoh, terasnya ditulis dalam C, menggabungkan kecekapan dan ciri-ciri berorientasikan objek C. 3) Prinsip kerja enjin JavaScript termasuk parsing, penyusun dan pelaksanaan, dan bahasa C memainkan peranan penting dalam proses ini.
 Peranan JavaScript: Membuat Web Interaktif dan DinamikApr 24, 2025 am 12:12 AM
JavaScript adalah di tengah -tengah laman web moden kerana ia meningkatkan interaktiviti dan dinamik laman web. 1) Ia membolehkan untuk menukar kandungan tanpa menyegarkan halaman, 2) memanipulasi laman web melalui Domapi, 3) menyokong kesan interaktif kompleks seperti animasi dan drag-and-drop, 4) mengoptimumkan prestasi dan amalan terbaik untuk meningkatkan pengalaman pengguna.
 C dan JavaScript: Sambungan dijelaskanApr 23, 2025 am 12:07 AM
C dan JavaScript mencapai interoperabilitas melalui webassembly. 1) Kod C disusun ke dalam modul WebAssembly dan diperkenalkan ke dalam persekitaran JavaScript untuk meningkatkan kuasa pengkomputeran. 2) Dalam pembangunan permainan, C mengendalikan enjin fizik dan rendering grafik, dan JavaScript bertanggungjawab untuk logik permainan dan antara muka pengguna.
 Dari laman web ke aplikasi: Aplikasi pelbagai JavaScriptApr 22, 2025 am 12:02 AM
JavaScript digunakan secara meluas di laman web, aplikasi mudah alih, aplikasi desktop dan pengaturcaraan sisi pelayan. 1) Dalam pembangunan laman web, JavaScript mengendalikan DOM bersama -sama dengan HTML dan CSS untuk mencapai kesan dinamik dan menyokong rangka kerja seperti JQuery dan React. 2) Melalui reaktnatif dan ionik, JavaScript digunakan untuk membangunkan aplikasi mudah alih rentas platform. 3) Rangka kerja elektron membolehkan JavaScript membina aplikasi desktop. 4) Node.js membolehkan JavaScript berjalan di sisi pelayan dan menyokong permintaan serentak yang tinggi.
 Python vs JavaScript: Gunakan Kes dan Aplikasi MembandingkanApr 21, 2025 am 12:01 AM
Python lebih sesuai untuk sains data dan automasi, manakala JavaScript lebih sesuai untuk pembangunan front-end dan penuh. 1. Python berfungsi dengan baik dalam sains data dan pembelajaran mesin, menggunakan perpustakaan seperti numpy dan panda untuk pemprosesan data dan pemodelan. 2. Python adalah ringkas dan cekap dalam automasi dan skrip. 3. JavaScript sangat diperlukan dalam pembangunan front-end dan digunakan untuk membina laman web dinamik dan aplikasi satu halaman. 4. JavaScript memainkan peranan dalam pembangunan back-end melalui Node.js dan menyokong pembangunan stack penuh.


Alat AI Hot

Undresser.AI Undress
Apl berkuasa AI untuk mencipta foto bogel yang realistik

AI Clothes Remover
Alat AI dalam talian untuk mengeluarkan pakaian daripada foto.

Undress AI Tool
Gambar buka pakaian secara percuma

Clothoff.io
Penyingkiran pakaian AI

Video Face Swap
Tukar muka dalam mana-mana video dengan mudah menggunakan alat tukar muka AI percuma kami!

Artikel Panas

Alat panas

EditPlus versi Cina retak
Saiz kecil, penyerlahan sintaks, tidak menyokong fungsi gesaan kod

SublimeText3 versi Inggeris
Disyorkan: Versi Win, menyokong gesaan kod!

Dreamweaver Mac版
Alat pembangunan web visual

Versi Mac WebStorm
Alat pembangunan JavaScript yang berguna

SecLists
SecLists ialah rakan penguji keselamatan muktamad. Ia ialah koleksi pelbagai jenis senarai yang kerap digunakan semasa penilaian keselamatan, semuanya di satu tempat. SecLists membantu menjadikan ujian keselamatan lebih cekap dan produktif dengan menyediakan semua senarai yang mungkin diperlukan oleh penguji keselamatan dengan mudah. Jenis senarai termasuk nama pengguna, kata laluan, URL, muatan kabur, corak data sensitif, cangkerang web dan banyak lagi. Penguji hanya boleh menarik repositori ini ke mesin ujian baharu dan dia akan mempunyai akses kepada setiap jenis senarai yang dia perlukan.


