xCharts-D3 기반 JavaScript 차트 라이브러리 코드 상세 설명(그림)
- 黄舟원래의
- 2017-03-16 14:42:162141검색
xCharts-D3 기반 JavaScript 차트 라이브러리 코드 상세(그림)
xCharts는 D3을 기반으로 한 JavaScript 차트 라이브러리입니다. xCharts는 매우 강력하며 다양한 차트 유형을 지원할 뿐만 아니라 풍부한 차트 테마 스타일을 갖추고 있습니다. 또한 xCharts의 디자인은 매우 유연하고 구성이 비교적 간단하며 로딩 속도도 나쁘지 않습니다. 개방성이 뛰어나고 사용자 정의가 가능한 JavaScript 차트 애플리케이션입니다.
xCharts의 기능
은 JavaScript 기반이므로 브라우저만 있으면 사용할 수 있고, 플랫폼 호환성도 좋습니다.
개방적이고 사용자 정의가 가능하므로 구성이 매우 유연합니다.
은 SVG 형식을 지원하므로 차트 데이터도 쉽게 내보낼 수 있습니다.
xCharts 사용법
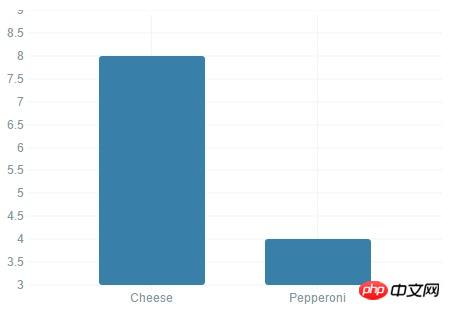
간단한 세로 막대형 차트
JavaScript 코드:
var data = {
  "xScale": "ordinal",
  "yScale": "linear",
  "main": [
    {
      "className": ".pizza",
      "data": [
        {
          "x": "Pepperoni",
          "y": 4
        },
        {
          "x": "Cheese",
          "y": 8
        }
      ]
    }
  ]
};
var myChart = new xChart('bar', data, '#example1');
렌더링:

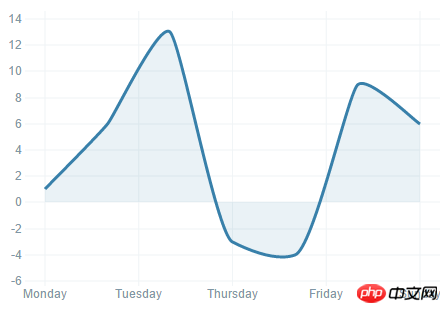
선형 그래프
JavaScript 코드:
var data = {
  "xScale": "time",
  "yScale": "linear",
  "type": "line",
  "main": [
    {
      "className": ".pizza",
      "data": [
        {
          "x": "2012-11-05",
          "y": 1
        },
        {
          "x": "2012-11-06",
          "y": 6
        },
        {
          "x": "2012-11-07",
          "y": 13
        },
        {
          "x": "2012-11-08",
          "y": -3
        },
        {
          "x": "2012-11-09",
          "y": -4
        },
        {
          "x": "2012-11-10",
          "y": 9
        },
        {
          "x": "2012-11-11",
          "y": 6
        }
      ]
    }
  ]
};
var opts = {
  "dataFormatX": function (x) { return d3.time.format('%Y-%m-%d').parse(x); },
  "tickFormatX": function (x) { return d3.time.format('%A')(x); }
};
var myChart = new xChart('line', data, '#example3', opts);
렌더링:

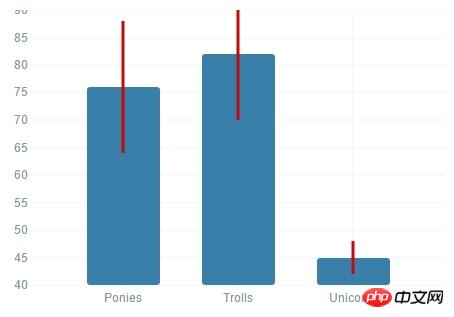
애니메이션막대형 차트
JavaScript 코드:
var errorBar = {
  enter: function (self, storage, className, data, callbacks) {
    var insertionPoint = xChart.visutils.getInsertionPoint(9),
      container,
      // Map each error bar into 3 points, so it's easier to draw as a single path
      // Converts each point to a triplet with y from (y - e) to (y + e)
      // It would be better to use the `preUpdateScale` method here,
      // but for this quick example, we're taking a shortcut
      eData = data.map(function (d) {
        d.data = d.data.map(function (d) {
          return [{x: d.x, y: d.y - d.e}, {x: d.x, y: d.y}, {x: d.x, y: d.y + d.e}];
        });
        return d;
      }),
      paths;

    // It's always a good idea to create containers for sets
    container = self._g.selectAll('.errorLine' + className)
xChart.setVis('error', errorBar);
var data = {
    "xScale": "ordinal",
    "yScale": "linear",
    "main": [
      {
        "className": ".errorExample",
        "data": [
          {
            "x": "Ponies",
            "y": 12
          },
          {
            "x": "Unicorns",
            "y": 23
          },
          {
            "x": "Trolls",
            "y": 1
          }
        ]
      }
    ],
    "comp": [
      {
        "type": "error",
        "className": ".comp.errorBar",
        "data": [
          {
            "x": "Ponies",
            "y": 12,
            "e": 5
          },
          {
            "x": "Unicorns",
            "y": 23,
            "e": 2
          },
          {
            "x": "Trolls",
            "y": 1,
            "e": 1
          }
        ]
      }
    ]
  };
렌더링:

요약
xCharts는 매우 강력합니다. 웹 애플리케이션에서 차트를 사용해야 한다면 xCharts가 매우 적합합니다.
위 내용은 xCharts-D3 기반 JavaScript 차트 라이브러리 코드 상세 설명(그림)의 상세 내용입니다. 자세한 내용은 PHP 중국어 웹사이트의 기타 관련 기사를 참조하세요!
성명:
본 글의 내용은 네티즌들의 자발적인 기여로 작성되었으며, 저작권은 원저작자에게 있습니다. 본 사이트는 이에 상응하는 법적 책임을 지지 않습니다. 표절이나 침해가 의심되는 콘텐츠를 발견한 경우 admin@php.cn으로 문의하세요.

