
ホームページ >バックエンド開発 >Python チュートリアル >Pandas+Pyecharts | 過去 5 年間の北京の過去の気象データの視覚化
Pandas+Pyecharts | 過去 5 年間の北京の過去の気象データの視覚化

- Python当打之年転載
- 2023-08-09 15:29:261057ブラウズ
この問題では、Python の pyecharts 視覚化ライブラリ Plot # を使用します。 ##北京の過去の気象データ 過去の最高気温と過去の最低気温分布、昼と夜の風力と風向分布を確認するには, 皆さんのお役に立てば幸いです。ご質問や改善が必要な点がある場合は、編集者までご連絡ください。
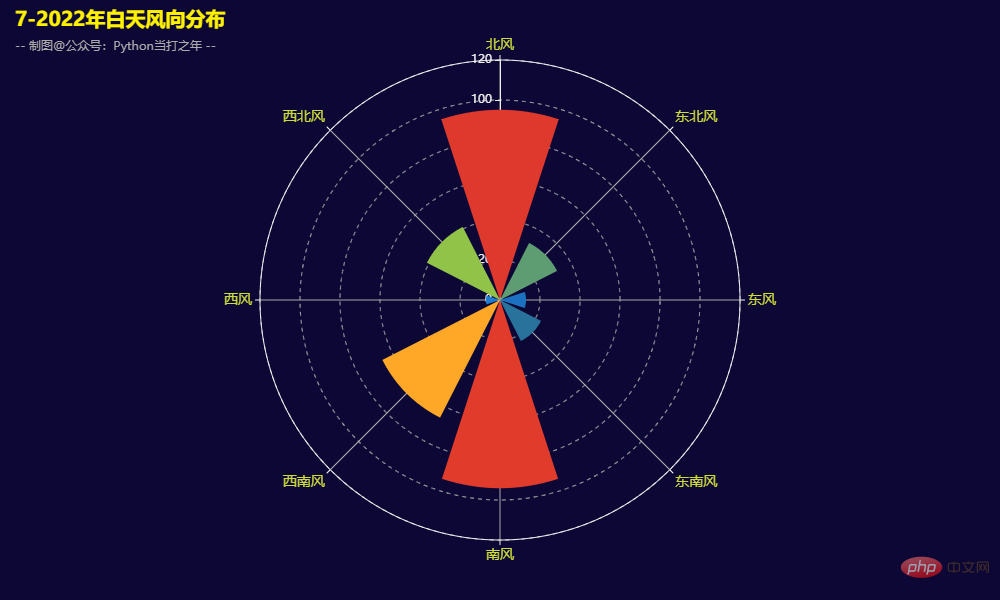
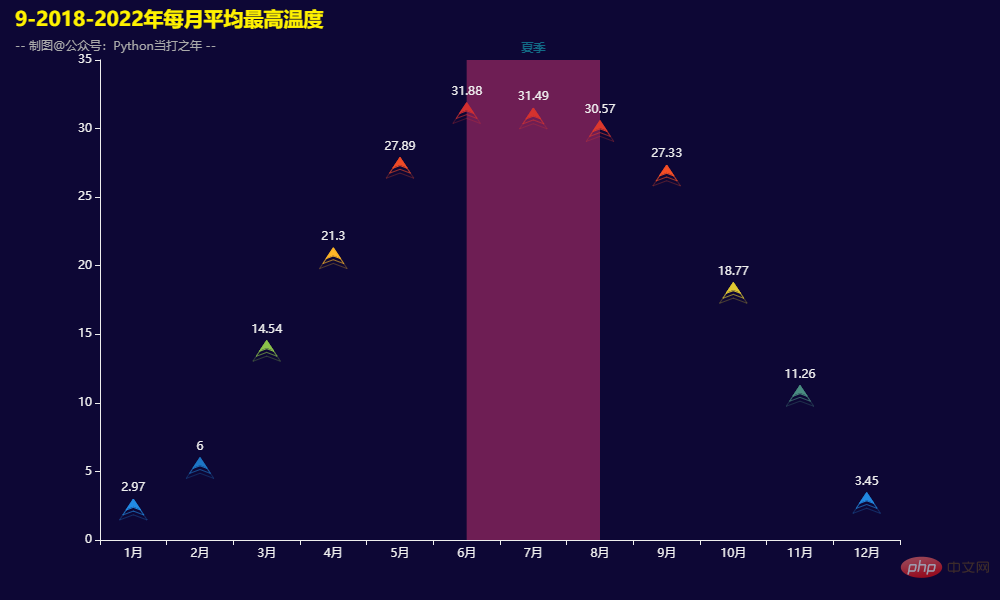
関連するライブラリ: Pandas 2.3 处理日期数据 3.5 2022年夜间_白天风力分布 3.7 2022年白天风向分布 3.8 2018-2022年各类型天气数量 3.9 2018-2022年每月平均最高温度
— データ処理Pyecharts
— データの視覚化 import pandas as pd
from pyecharts.charts import Line
from pyecharts.charts import Bar
from pyecharts.charts import Scatter
from pyecharts.charts import Pie
from pyecharts.charts import EffectScatter
from pyecharts.charts import Calendar
from pyecharts.charts import Polar
from pyecharts import options as opts
import warnings
warnings.filterwarnings('ignore')
df_weather = pd.read_excel('./2018-2022年天气数据.xlsx')
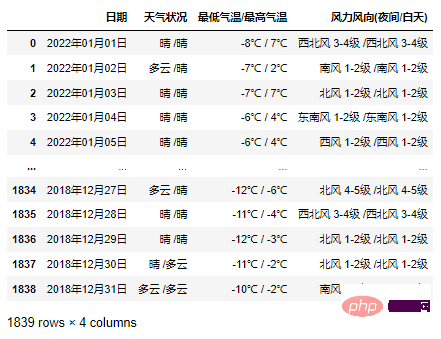 2018 年から 2022 年までの合計
 df_weather_1 = df_weather.copy()
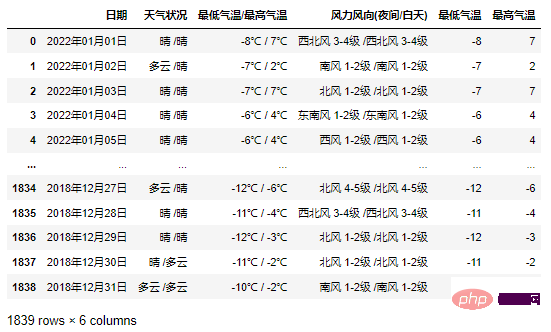
df_weather_1[['最低气温','最高气温']] = df_weather_1['最低气温/最高气温'].str.split(' / ',expand=True)
df_weather_1['最低气温'] = df_weather_1['最低气温'].str[:-2]
df_weather_1['最高气温'] = df_weather_1['最高气温'].str[:-1]
df_weather_1['最低气温'] = df_weather_1['最低气温'].astype('int')
df_weather_1['最高气温'] = df_weather_1['最高气温'].astype('int')
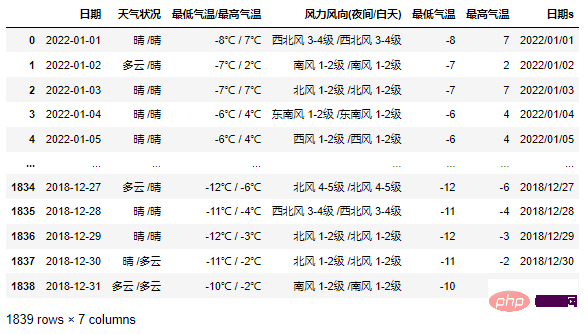
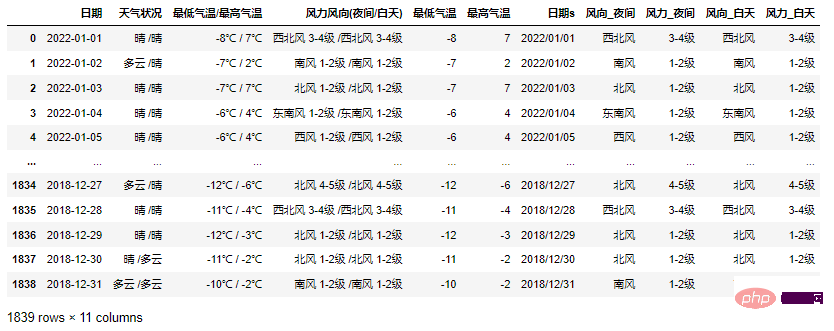
df_weather_1['日期'] = pd.to_datetime(df_weather_1['日期'],format='%Y年%m月%d日')
df_weather_1['日期s'] = df_weather_1['日期'].dt.strftime('%Y/%m/%d')
def get_scatter():
scatter = (
Scatter()
.add_xaxis(x_data)
.add_yaxis("最低气温", y_data1)
.add_yaxis("最高气温", y_data2)
.set_global_opts(
legend_opts=opts.LegendOpts(is_show=False),
visualmap_opts=opts.VisualMapOpts(
is_show=False,
range_color=range_color
),
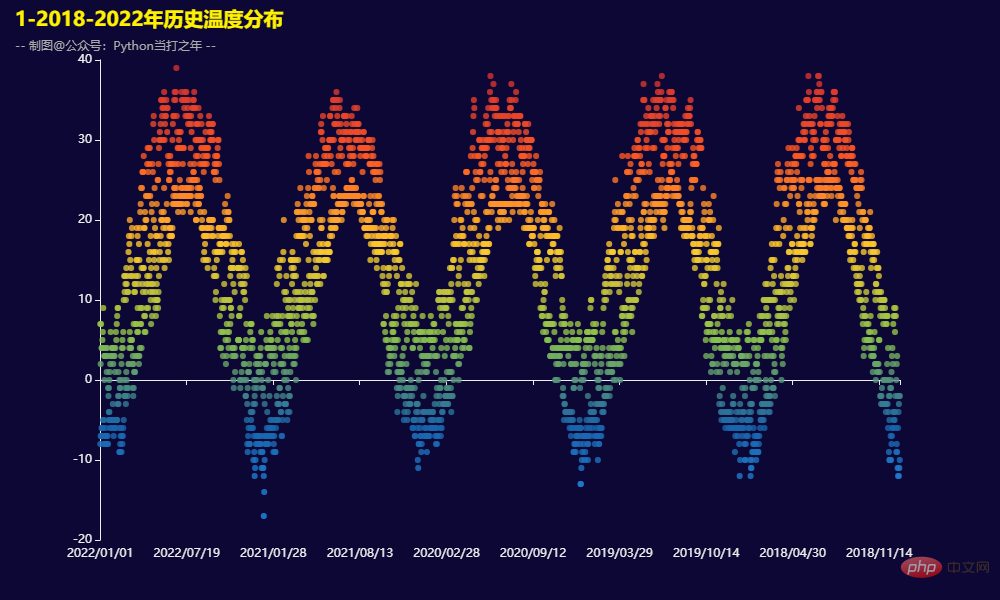
title_opts=opts.TitleOpts(
title='1-2018-2022年历史温度分布',
subtitle='-- 制图@公众号:Python当打之年 --',
pos_top='1%',
pos_left="1%",
)
)
)
def get_calendar():
calendar = (
Calendar()
.add('',
data_21,
calendar_opts=opts.CalendarOpts(
pos_right='5%',
range_='2021',
daylabel_opts=opts.CalendarDayLabelOpts(name_map='cn'),
monthlabel_opts=opts.CalendarMonthLabelOpts(name_map='cn')
),
)
.set_global_opts(
title_opts=opts.TitleOpts(
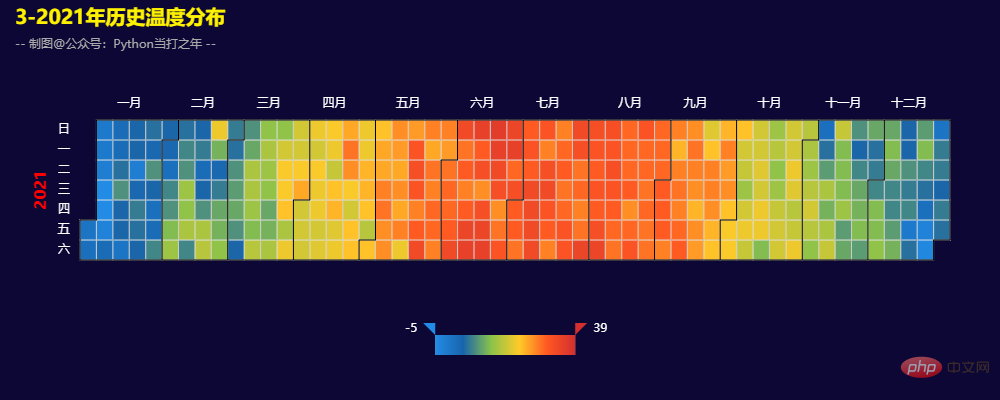
title='3-2021年历史温度分布',
subtitle='-- 制图@公众号:Python当打之年 --',
pos_top='1%',
pos_left="1%",
),
visualmap_opts=opts.VisualMapOpts(
range_color=range_color,
)
)
)

def get_pie():
pie = (
Pie()
.add(
"",
[list(z) for z in zip(x_data, y_data1)],
radius=["30%", "50%"],
center=["30%", "55%"],
)
.add(
"",
[list(z) for z in zip(x_data, y_data2)],
radius=["30%", "50%"],
center=["70%", "55%"],
)
.set_global_opts(
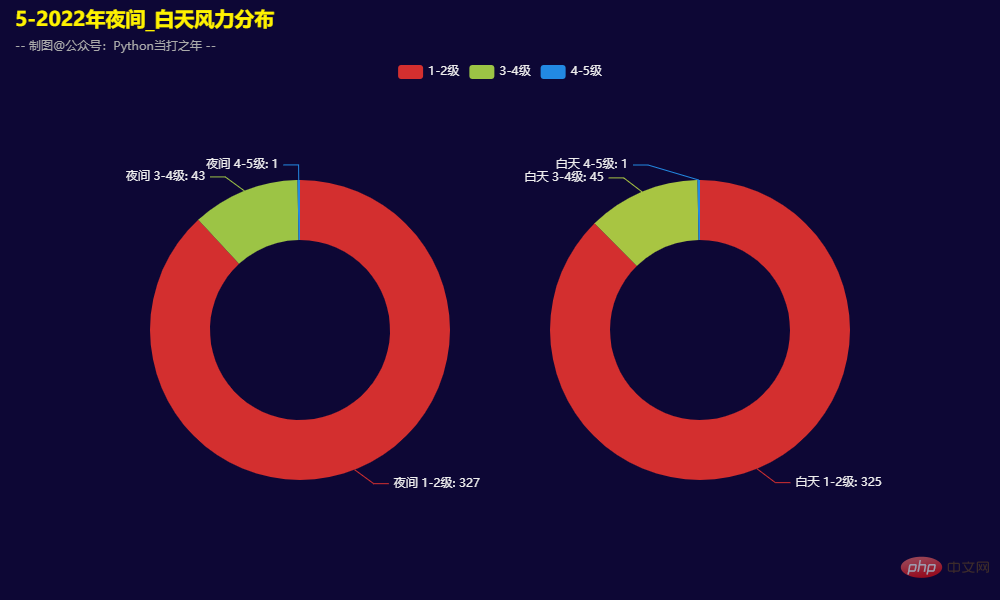
title_opts=opts.TitleOpts(
title='5-2022年夜间_白天风力分布',
subtitle='-- 制图@公众号:Python当打之年 --',
pos_top='1%',
pos_left="1%",
),
legend_opts=opts.LegendOpts(pos_top='10%'),
visualmap_opts=opts.VisualMapOpts(
is_show=False,
range_color=range_color
),
)
)
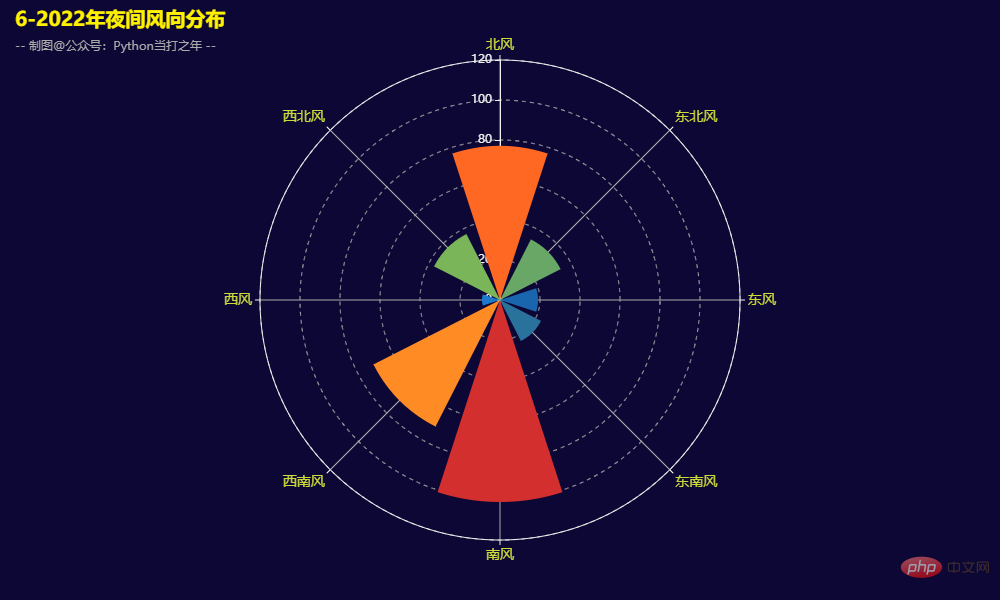
def get_polor():
    polor = (
        Polar()
        .add("", values,type_="bar")
        .set_global_opts(
            legend_opts=opts.LegendOpts(is_show=False),
            visualmap_opts=opts.VisualMapOpts(
                is_show=False,
                range_color=range_color
            ),
            title_opts=opts.TitleOpts(
                title='6-2022年夜间风向分布',
                subtitle='-- 制图@公众号:Python当打之年 --',
                pos_top='1%',
                pos_left="1%",
            ),
        )
    )
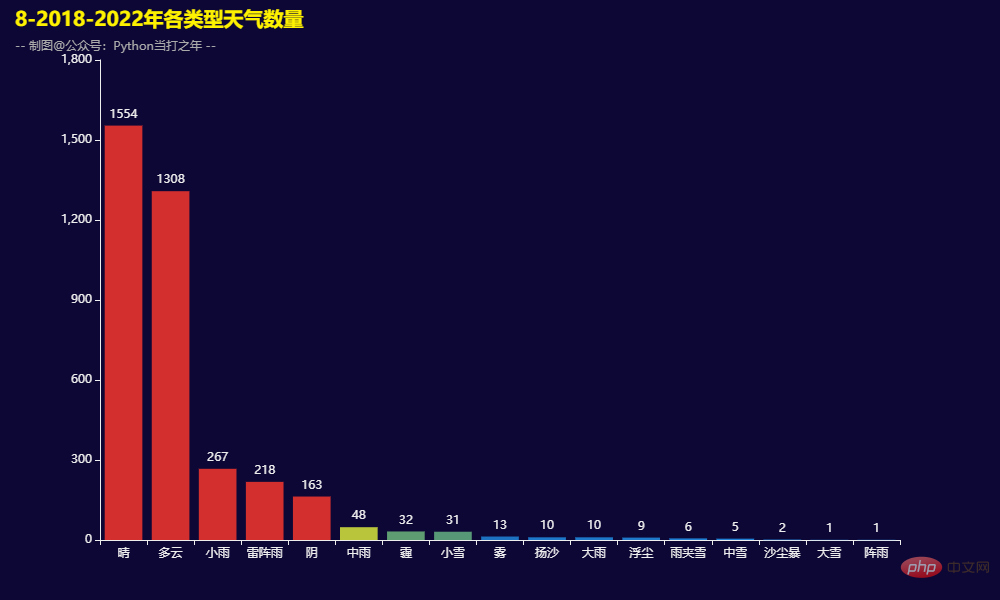
def get_bar():
    bar = (
        Bar()
        .add_xaxis(x_data)
        .add_yaxis("",y_data)
        .set_global_opts(
            visualmap_opts=opts.VisualMapOpts(
                is_show=False,
                range_color=range_color
            ),
            legend_opts=opts.LegendOpts(is_show=False),
            title_opts=opts.TitleOpts(
                title='8-2018-2022年各类型天气数量',
                subtitle='-- 制图@公众号:Python当打之年 --',
                pos_top='1%',
                pos_left="1%",
            ),
        )
    )
以上がPandas+Pyecharts | 過去 5 年間の北京の過去の気象データの視覚化の詳細内容です。詳細については、PHP 中国語 Web サイトの他の関連記事を参照してください。