ホームページ >バックエンド開発 >Python チュートリアル >Pythonを使用してフラクタルパターンを描画する方法
Pythonを使用してフラクタルパターンを描画する方法
- WBOY転載
- 2023-05-07 13:55:071375ブラウズ
1. 目標
正三角形を描画できるプログラムを作成し、三角形の各辺に、少し小さい外向きの三角形を描画できる必要があります。このプロセスを何度でも繰り返すことができるため、いくつかの興味深いパターンが作成されます。
2. 画像を表現します
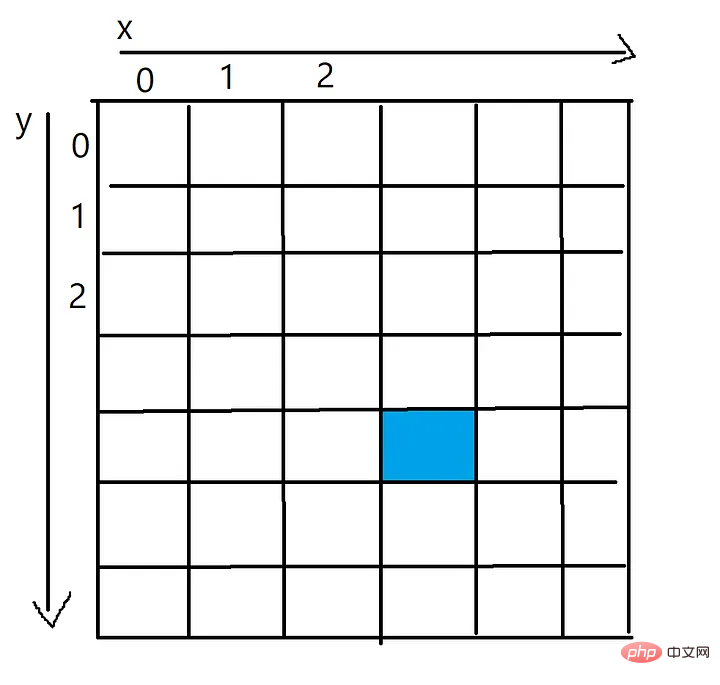
画像を 2 次元のピクセル配列として表現します。ピクセル配列内の各セルは、そのピクセルの色 (RGB) を表します。
これを行うには、NumPy ライブラリを使用してピクセル配列を生成し、Pillow を使用してそれを保存可能な画像に変換します。

青いピクセルの x 値は 3、y 値は 4 で、ピクセル[4][3 などの 2 次元配列を通じてアクセスできます。 ]
3. 線を引く
さて、コーディングを始めましょう まず、2 つの座標セットを取得し、それらの間に線を引くことができる関数が必要です。
以下のコードは、2 点間を補間し、各ステップでピクセル配列に新しいピクセルを追加することによって機能します。このプロセスは、ライン上でピクセルごとにシェーディングすることと考えることができます。
各コード スニペットで連続文字「\」を使用すると、コードの長い行に対応できます。
import numpy as np
from PIL import Image
import math
def plot_line(from_coordinates, to_coordinates, thickness, colour, pixels):
# 找出像素阵列的边界
max_x_coordinate = len(pixels[0])
max_y_coordinate = len(pixels)
# 两点之间沿着x轴和y轴的距离
horizontal_distance = to_coordinates[1] - from_coordinates[1]
vertical_distance = to_coordinates[0] - from_coordinates[0]
# 两点之间的总距离
distance = math.sqrt((to_coordinates[1] - from_coordinates[1])**2 \
+ (to_coordinates[0] - from_coordinates[0])**2)
# 每次给一个新的像素上色时,将向前走多远
horizontal_step = horizontal_distance/distance
vertical_step = vertical_distance/distance
# 此时,将进入循环以在像素数组中绘制线
# 循环的每一次迭代都会沿着线添加一个新的点
for i in range(round(distance)):
# 这两个坐标是直线中心的坐标
current_x_coordinate = round(from_coordinates[1] + (horizontal_step*i))
current_y_coordinate = round(from_coordinates[0] + (vertical_step*i))
# 一旦得到了点的坐标,
# 就在坐标周围画出尺寸为thickness的图案
for x in range (-thickness, thickness):
for y in range (-thickness, thickness):
x_value = current_x_coordinate + x
y_value = current_y_coordinate + y
if (x_value > 0 and x_value < max_x_coordinate and \
y_value > 0 and y_value < max_y_coordinate):
pixels[y_value][x_value] = colour
# 定义图像的大小
pixels = np.zeros( (500,500,3), dtype=np.uint8 )
# 画一条线
plot_line([0,0], [499,499], 1, [255,200,0], pixels)
# 把像素阵列变成一张真正的图片
img = Image.fromarray(pixels)
# 显示得到的图片,并保存它
img.show()
img.save('Line.png')
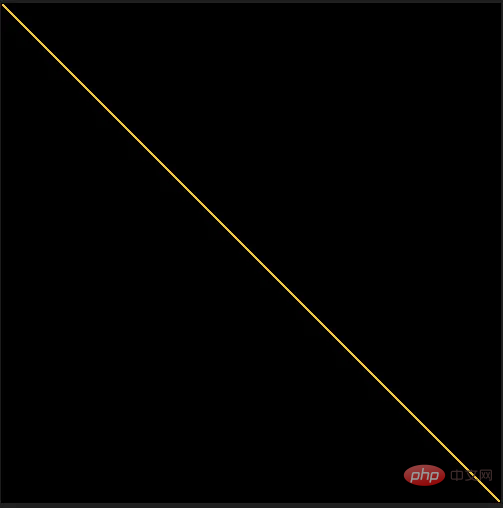
ピクセル配列の各隅の間に黄色の線を描画するときのこの関数の結果
4. 三角形を描画します
2 点間に線を引く関数ができたので、最初の正三角形を描くことができます。
三角形の中心点と辺の長さを指定すると、高さは次の公式を使用して計算できます: h = ½(√3a)。
この高さ、中心点、辺の長さを使用して、三角形の各角の位置を計算できます。前に作成した plot_line 関数を使用して、各角の間に線を引くことができます。
def draw_triangle(center, side_length, thickness, colour, pixels):
    # 等边三角形的高度是,h = ½(√3a)
    # 其中a是边长
    triangle_height = round(side_length * math.sqrt(3)/2)
    # 顶角
    top = [center[0] - triangle_height/2, center[1]]
    # 左下角
    bottom_left = [center[0] + triangle_height/2, center[1] - side_length/2]
    # 右下角
    bottom_right = [center[0] + triangle_height/2, center[1] + side_length/2]
    # 在每个角之间画一条线来完成三角形
    plot_line(top, bottom_left, thickness, colour, pixels)
    plot_line(top, bottom_right, thickness, colour, pixels)
    plot_line(bottom_left, bottom_right, thickness, colour, pixels)
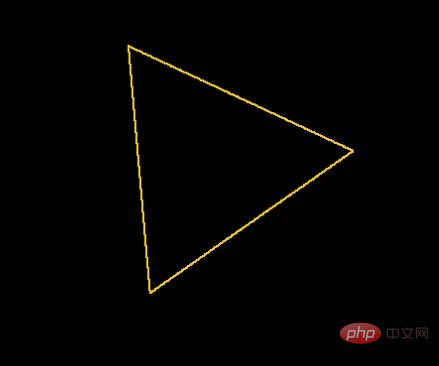
500x500 ピクセル PNG
5 の中心に三角形を描画した結果。フラクタルの生成
すべての準備が整いました。 Python で最初のフラクタルを作成できます。
しかし、最後のステップは完了するのが最も困難です。三角形関数はその各辺に対してそれ自体を呼び出します。新しい小さな三角形のそれぞれの中心点を計算し、それらが正しく回転できるようにする必要があります。それらに垂直な方向 それが取り付けられる側。
この関数を使用すると、回転された座標から中心点のオフセットを減算し、座標のペアを回転する式を適用することで、三角形の各角を回転できます。
def rotate(coordinate, center_point, degrees):
    # 从坐标中减去旋转的点
    x = (coordinate[0] - center_point[0])
    y = (coordinate[1] - center_point[1])
    # Python的cos和sin函数采用弧度而不是度数
    radians = math.radians(degrees)
    # 计算旋转点
    new_x = (x * math.cos(radians)) - (y * math.sin(radians))
    new_y = (y * math.cos(radians)) + (x * math.sin(radians))
    # 将在开始时减去的偏移量加回旋转点上
    return [new_x + center_point[0], new_y + center_point[1]]
三角形の各座標を 35 度回転します
三角形を回転できたら、最初の三角形 A の各辺に描画する方法を考えます。新しい小さな三角形。
これを実現するには、draw_triangle 関数を拡張して、各辺の新しい三角形の回転と中心点を計算します。辺の長さは引数 shrink_side_by によって削減されます。 。
新しい三角形の中心点と回転を計算したら、draw_triangle(self) を呼び出して、現在のラインの中心から新しい小さな三角形を描画します。これにより、同じコード ブロックが順番にヒットし、より小さい三角形の中心点と回転の別のセットが計算されます。
これはループ アルゴリズムと呼ばれます。draw_triangle 関数は、描画する三角形の最大深度に達するまで自分自身を呼び出すためです。理論的には関数が永久にループするため、このエスケープ文があることは重要です (ただし、実際には呼び出しスタックが大きくなりすぎ、スタック オーバーフロー エラーが発生します)。
def draw_triangle(center, side_length, degrees_rotate, thickness, colour, \
                  pixels, shrink_side_by, iteration, max_depth):
    # 等边三角形的高度是,h = ½(√3a)
    # 其中'a'是边长
    triangle_height = side_length * math.sqrt(3)/2
    # 顶角
    top = [center[0] - triangle_height/2, center[1]]
    # 左下角
    bottom_left = [center[0] + triangle_height/2, center[1] - side_length/2]
    # 右下角
    bottom_right = [center[0] + triangle_height/2, center[1] + side_length/2]
    if (degrees_rotate != 0):
        top = rotate(top, center, degrees_rotate)
        bottom_left = rotate(bottom_left, center, degrees_rotate)
        bottom_right = rotate(bottom_right, center, degrees_rotate)
    # 三角形各边之间的坐标
    lines = [[top, bottom_left],[top, bottom_right],[bottom_left, bottom_right]]
    line_number = 0
    # 在每个角之间画一条线来完成三角形
    for line in lines:
        line_number += 1
        plot_line(line[0], line[1], thickness, colour, pixels)
        # 如果还没有达到max_depth,就画一些新的三角形
        if (iteration < max_depth and (iteration < 1 or line_number < 3)):
            gradient = (line[1][0] - line[0][0]) / (line[1][1] - line[0][1])
            new_side_length = side_length*shrink_side_by
            # 正在绘制的三角形线的中心
            center_of_line = [(line[0][0] + line[1][0]) / 2, \
                              (line[0][1] + line[1][1]) / 2]
            new_center = []
            new_rotation = degrees_rotate
            # 需要旋转traingle的数量
            if (line_number == 1):
                new_rotation += 60
            elif (line_number == 2):
                new_rotation -= 60
            else:
                new_rotation += 180
            # 在一个理想的世界里,这将是gradient=0,
            # 但由于浮点除法的原因,无法
            # 确保永远是这种情况
            if (gradient < 0.0001 and gradient > -0.0001):
                if (center_of_line[0] - center[0] > 0):
                    new_center = [center_of_line[0] + triangle_height * \
                                 (shrink_side_by/2), center_of_line[1]]
                else:
                    new_center = [center_of_line[0] - triangle_height * \
                                  (shrink_side_by/2), center_of_line[1]]
            else:
                # 计算直线梯度的法线
                difference_from_center = -1/gradient
                # 计算这条线距中心的距离
                # 到新三角形的中心
                distance_from_center = triangle_height * (shrink_side_by/2)
                # 计算 x 方向的长度,
                # 从线的中心到新三角形的中心
                x_length = math.sqrt((distance_from_center**2)/ \
                                     (1 + difference_from_center**2))
                # 计算出x方向需要走哪条路
                if (center_of_line[1] < center[1] and x_length > 0):
                    x_length *= -1
                # 现在计算Y方向的长度
                y_length = x_length * difference_from_center
                # 用新的x和y值来偏移线的中心
                new_center = [center_of_line[0] + y_length, \
                              center_of_line[1] + x_length]
            draw_triangle(new_center, new_side_length, new_rotation, \
                          thickness, colour, pixels, shrink_side_by, \
                          iteration+1, max_depth)
三角形フラクタル、収縮辺 = 1/2、最大深さ = 2
以上がPythonを使用してフラクタルパターンを描画する方法の詳細内容です。詳細については、PHP 中国語 Web サイトの他の関連記事を参照してください。

