ホームページ >ウェブフロントエンド >jsチュートリアル >D3.jsによる物流マップ作成例の共有
D3.jsによる物流マップ作成例の共有
- 小云云オリジナル
- 2018-01-29 09:11:362424ブラウズ
この記事では主にD3.jsを使って物流マップを作成するサンプルコードを紹介していますが、編集者がとても良いと思ったので、参考として共有させていただきます。編集者をフォローして見てみましょう。皆さんのお役に立てれば幸いです。
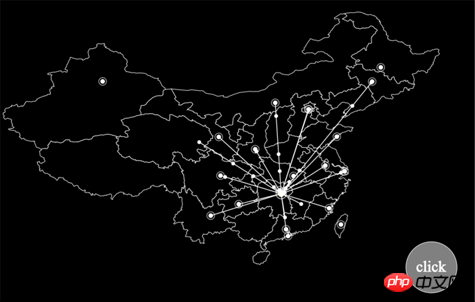
サンプル画像

制作アイデア
背景として中国の地図を描く必要があります。
道路シートの始点と終点を描画するには、主要都市の緯度と経度の座標が必要です。
物流を受注した都市が点滅マークを描きます。
物流オーダーの対象都市が既に存在するため、ルートは描画されません。
新しい物流注文が生成されるたびに、ターゲットまでのルートに沿ってマークが移動するアニメーション効果が発生します。
ブラウザのリソース使用量を減らすために、描画後のデータをクリーンアップする必要があります。
コーディングを開始します
1. Web ページテンプレートを作成します
デバッグを容易にするために、d3.js ファイルをローカルにダウンロードします。 。 D3 の V4 バージョンが使用されるため、V3 バージョンとは異なることに注意してください。<!DOCTYPE html>
<html lang="en">
<head>
<meta charset="utf8">
<script type="text/javascript" src="../../static/d3/d3.js"></script>
<title>地图</title>
</head>
<body>
<p class="fxmap">
</p>
</body>
<script type="text/javascript"></script>
</html>SVGを作成します。以下のコードはすべて3f1c4e4b6b16bbbd69b2ee476dc4f83a2cacc6d41bbb37262a98f745aa00fbf0に配置されます
var width=1000 , height=800; // 定义SVG宽高
var svg = d3.select("body p.fxmap")
            .append("svg")
            .attr("width", "width)
            .attr("height", height)
            .style("background","#000"); //
SVGグラフィックグループを作成して
- gmpを呼び出す準備をし、背景マップを保存しますそしてスタート地点のマーク。
- mline は、始点とターゲットの間の接続およびターゲット ポイントを保存します。
- ボタン、テスト用ボタン
gmap = svg.append("g").attr("id", "map").attr("stroke", "white").attr("stroke-width",1);
    mline = svg.append("g").attr("id", "moveto").attr("stroke", "#FFF").attr("stroke-width", 1.5).attr("fill","#FFF");
    button = svg.append("g").attr("id", "button").attr("stroke", "white").attr("stroke-width", 1).attr("fill", "white");
投影関数を作成します
- 経度と緯度は描画に直接使用できないため、平面座標に変換する必要があります。 d3js は、比較的豊富な投影メソッドを提供します。この例では、 geoEquirectangular() メソッドが使用されます。
- 投影は、経度および緯度を平面座標に変換する方法です
- パスは、経度および緯度を線を接続するための点座標に変換する方法です(パスを構築するための関数を作成する手間を省きます)
var projection = d3.geoEquirectangular()
              .center([465,395]) // 指定投影中心,注意[]中的是经纬度
              .scale(height)
              .translate([width / 2, height / 2]);
var path = d3.geoPath().projection(projection);
複数の接続エンドポイントを呼び出せるようにマーカーを作成します。 複数の物流接続エンドポイントがあるため、それらはすべて 1 つのマーカーで呼び出されます。
- このマークは真ん中の円+外側のリングで構成されています。外輪の点滅効果は別途作成します。
marker = svg.append("defs")
          .append("marker")
          .append("marker")
          .attr("id", "pointer")
          .attr("viewBox","0 0 12 12")  // 可见范围
          .attr("markerWidth","12")    // 标记宽度
          .attr("markerHeight","12")    // 标记高度
          .attr("orient", "auto")     //
          .attr("markerUnits", "strokeWidth") // 随连接线宽度进行缩放
          .attr("refX", "6")       // 连接点坐标
          .attr("refY", "6")
    // 绘制标记中心圆
    marker.append("circle")
        .attr("cx", "6")
        .attr("cy", "6")
        .attr("r", "3")
        .attr("fill", "white");
    // 绘制标记外圆,之后在timer()中添加闪烁效果
    marker.append("circle")
        .attr("id", "markerC")
        .attr("cx", "6")
        .attr("cy", "6")
        .attr("r", "5")
        .attr("fill-opacity", "0")
        .attr("stroke-width", "1")
        .attr("stroke", "white");
中国の地図を描き、出発点(長沙)をマークします
地図で使用される緯度と経度のセットは、オンラインにたくさんのファイルがあります
。
メソッドでは、目的地の都市名(city)と経度・緯度(データ)の入力が必要です
- 事前に確立したproject()メソッドを呼び出して、目的地の経度・緯度を平面座標に変換します。
- 始点(長沙)と終点の間の距離を線の長さとアニメーション時間のパラメータとして計算します。
- ライン上に円形のマークを描き、始点から終点までの動きをアニメーションさせます。
- マークは終点に移動した後、リソース節約のため削除されます。
- 以前に線点が描画されている場合、線は描画されず、移動マークのみが描画されます。
- 物流注文が処理されるたびに、都市レコードは +1 されます。
-
// 记录长沙坐标
    var changsha = projection([112.59,28.12]);
    // 读取地图数据,并绘制中国地图
    mapdata = [];
    d3.json('china.json', function(error, data){
      if (error)
        console.log(error);
      // 读取地图数据
      mapdata = data.features;
      // 绘制地图
      gmap.selectAll("path")
        .data(mapdata)
        .enter()
        .append("path")
        .attr("d", path);
      // 标记长沙
      gmap.append("circle").attr("id","changsha")
        .attr("cx", changsha[0])
        .attr("cy", changsha[1])
        .attr("r", "6")
        .attr("fill", "yellow")
      gmap.append("circle").attr("id","changshaC")
        .attr("cx", changsha[0])
        .attr("cy", changsha[1])
        .attr("r", "10")
        .attr("stroke-width", "2")
        .attr("fill-opacity", "0");
    });
マークの外側の円の点滅効果を実現するアニメーションキューの例を作成します
// 创建对象,保存每个城市的物流记录数量
    var citylist = new Object();
    // 创建方法,输入data坐标,绘制发射线
    var moveto = function(city, data){
      var pf = {x:projection([112.59,28.12])[0], y:projection([112.59,28.12])[1]};
      var pt = {x:projection(data)[0], y:projection(data)[1]};
      var distance = Math.sqrt((pt.x - pf.x)**2 + (pt.y - pf.y)**2);
      if (city in citylist){
        citylist[city]++;
      }else{
        mline.append("line")
            .attr("x1", pf.x)
            .attr("y1", pf.y)
            .attr("x2", pt.x)
            .attr("y2", pt.y)
            .attr("marker-end","url(#pointer)")
            .style("stroke-dasharray", " "+distance+", "+distance+" ")
            .transition()
            .duration(distance*30)
            .styleTween("stroke-dashoffset", function(){
              return d3.interpolateNumber(distance, 0);
            });
        citylist[city] = 1;
      };
      mline.append("circle")
        .attr("cx", pf.x)
        .attr("cy", pf.y)
        .attr("r", 3)
        .transition()
        .duration(distance*30)
        .attr("transform", "translate("+(pt.x-pf.x)+","+(pt.y-pf.y)+")")
        .remove();
    };
テストボタンを作成し、ターゲット都市データをテストします
var scale = d3.scaleLinear();
    scale.domain([0, 1000, 2000])
      .range([0, 1, 0]);
    var start = Date.now();
    d3.timer(function(){
      var s1 = scale((Date.now() - start)%2000);
      // console.log(s1);
      gmap.select("circle#changshaC")
        .attr("stroke-opacity", s1);
      marker.select("circle#markerC")
        .attr("stroke-opacity", s1);
    });
関連推奨事項:
Three.js 3Dマップ実装例の共有
d3.js描画ベクトルグラフィックス+ドラッグアンドドロップ実装アイデア
以上がD3.jsによる物流マップ作成例の共有の詳細内容です。詳細については、PHP 中国語 Web サイトの他の関連記事を参照してください。

