
ホームページ >バックエンド開発 >PHPチュートリアル >php7 での xhprof パフォーマンス分析ツールのインストールと使用に関するグラフィカル コード チュートリアル
php7 での xhprof パフォーマンス分析ツールのインストールと使用に関するグラフィカル コード チュートリアル

- 黄舟オリジナル
- 2017-08-10 11:15:573197ブラウズ
xhprof
cd xhprof/extension/
phpize
./configure
makemake install
をインストールし、必要に応じて
extension=xhprof.so
を/etc/php.iniに追加します。githubからクローンしたファイルのサンプルディレクトリ内のサンプルを直接実行できます
出力は次のとおりです
php -m | grep xhprof
次に、?run=592567308784c&source=xhprof_foo をコピーします
Visit
Array
(    [main()] => Array        (            [ct] => 1            [wt] => 9        ))
---------------Assuming you have set up the http based UI for
XHProf at some address, you can view run at
http://<xhprof-ui-address>/index.php?run=592567308784c&source=xhprof_foo
---------------
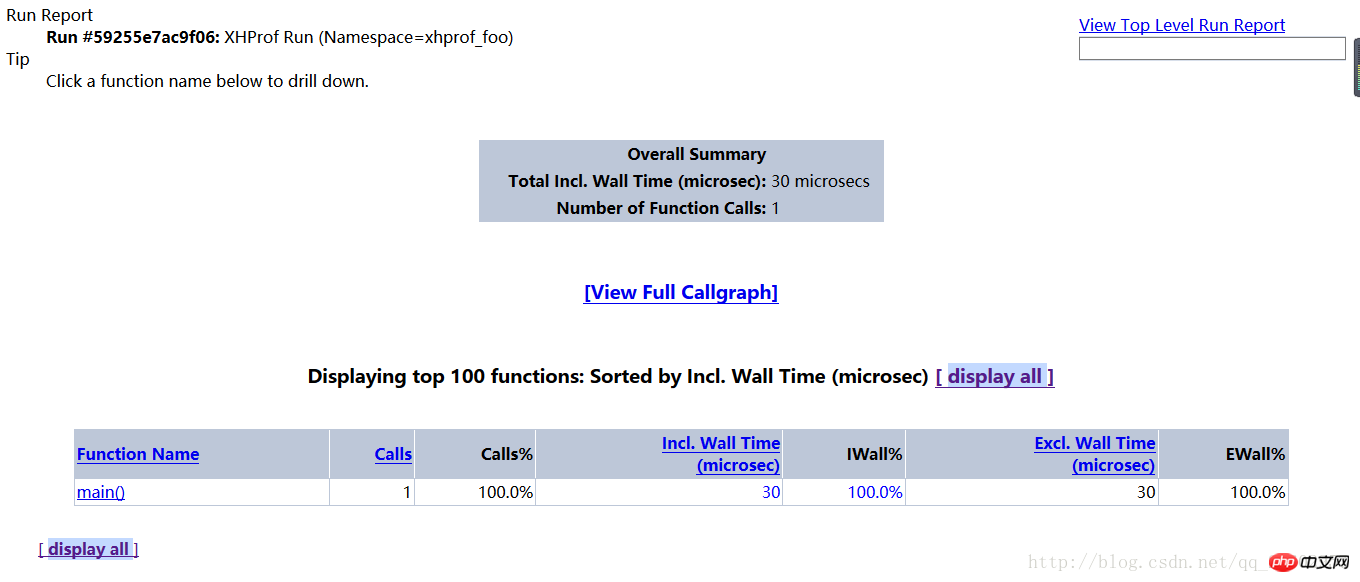
出力を確認できます
中央の View Full Callgraph をクリックしてパフォーマンス分析の画像を確認しますエラー報告
xhprof_html/index.php?run=592567308784c&source=xhprof_foorreee
 変更に適応する
たとえば、フレームワークのパフォーマンス分析など、独自のプロジェクトをテストしたい場合です。
xhprof_lib/utils/ にある 2 つのファイル
xhprof_lib.php と xhprof_runs.php をエントリ ファイルと同じディレクトリにコピーし、エントリ ファイルの末尾に
failed to execute cmd:" dot -Tpng". stderr:sh: dot:command not found。
add
//解决方案yum install graphviz
を追加して上記を取得します表示された URL にアクセスし、再度
// start profiling
xhprof_enable();
にアクセスすると、以下のページが表示されます
写真をご覧ください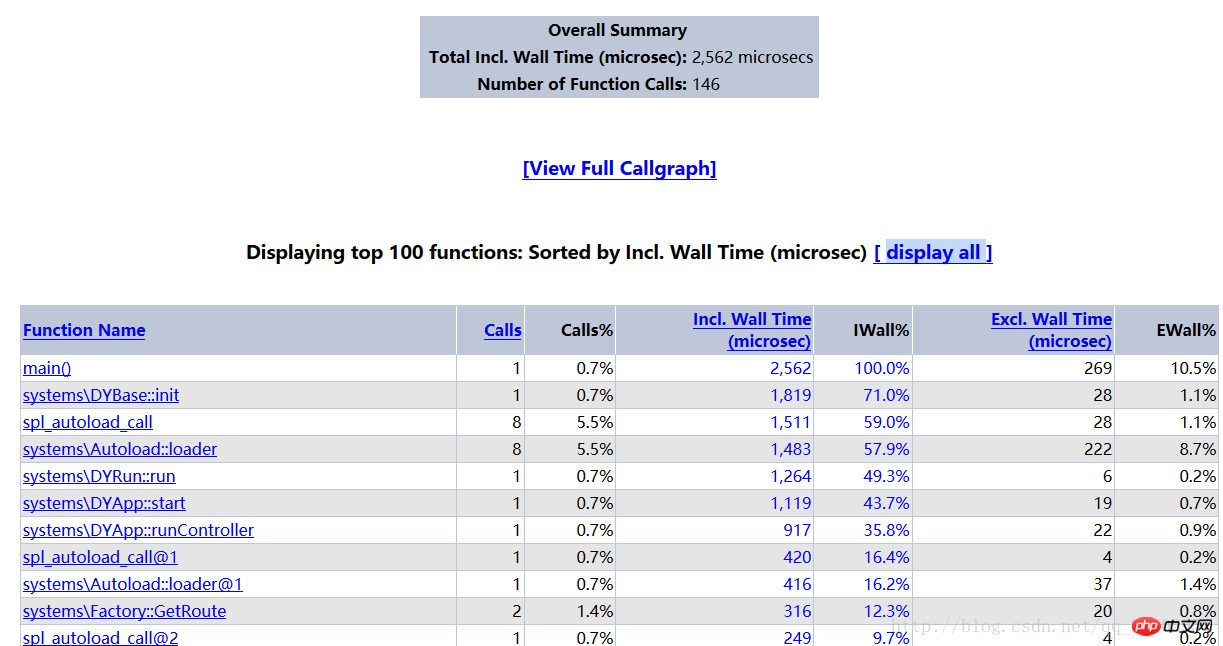
// stop profiler
$xhprof_data = xhprof_disable();

// display raw xhprof data for the profiler run
print_r($xhprof_data);


include_once "xhprof_lib.php";
include_once "xhprof_runs.php";

// save raw data for this profiler run using default
// implementation of iXHProfRuns.
$xhprof_runs = new XHProfRuns_Default();

// save the run under a namespace "xhprof_foo"
$run_id = $xhprof_runs->save_run($xhprof_data, "xhprof_foo");

echo "---------------\n".
     "Assuming you have set up the http based UI for \n".
     "XHProf at some address, you can view run at \n".
     "http://<xhprof-ui-address>/index.php?run=$run_id&source=xhprof_foo\n".
     "---------------\n";
以上がphp7 での xhprof パフォーマンス分析ツールのインストールと使用に関するグラフィカル コード チュートリアルの詳細内容です。詳細については、PHP 中国語 Web サイトの他の関連記事を参照してください。
声明:
この記事の内容はネチズンが自主的に寄稿したものであり、著作権は原著者に帰属します。このサイトは、それに相当する法的責任を負いません。盗作または侵害の疑いのあるコンテンツを見つけた場合は、admin@php.cn までご連絡ください。