ホームページ >バックエンド開発 >Python チュートリアル >Pandas を使用した JIRA 分析
Pandas を使用した JIRA 分析
- 王林オリジナル
- 2024-08-25 06:03:02988ブラウズ
問題
Atlassian JIRA が最も人気のある問題追跡ツールおよびプロジェクト管理ソリューションの 1 つであることに異論はありません。好きでも嫌いでも構いませんが、もしあなたがソフトウェア エンジニアとしてどこかの会社に雇われたのであれば、高い確率で JIRA に出会うでしょう。
取り組んでいるプロジェクトが非常に活発である場合、さまざまなタイプの JIRA 問題が何千も存在する可能性があります。エンジニアのチームを率いている場合は、JIRA に保存されているデータに基づいてプロジェクトで何が起こっているかを理解するのに役立つ分析ツールに興味があるかもしれません。 JIRA には、サードパーティのプラグインだけでなく、いくつかのレポート機能が統合されています。しかし、それらのほとんどは非常に基本的なものです。たとえば、かなり柔軟な「予測」ツールを見つけるのは困難です。
プロジェクトが大規模になればなるほど、統合レポート ツールに対する満足度は低くなります。ある時点で、API を使用してデータを抽出、操作、視覚化することになります。過去 15 年間の JIRA の使用中に、このドメイン周辺でさまざまなプログラミング言語によるそのようなスクリプトやサービスを多数見てきました。
日常的なタスクの多くは 1 回限りのデータ分析を必要とするため、毎回サービスを作成するのは効果がありません。 JIRA をデータ ソースとして扱い、一般的なデータ分析ツール ベルトを使用できます。たとえば、Jupyter を使用し、プロジェクト内の最近のバグのリストを取得し、「機能」(分析に役立つ属性) のリストを準備し、pandas を利用して統計を計算し、scikit-learn を使用して傾向を予測しようとします。今回はその方法について解説していきたいと思います。
準備
JIRA API アクセス
ここでは、JIRA のクラウド版について説明します。ただし、セルフホスト型バージョンを使用している場合、主な概念はほぼ同じです。
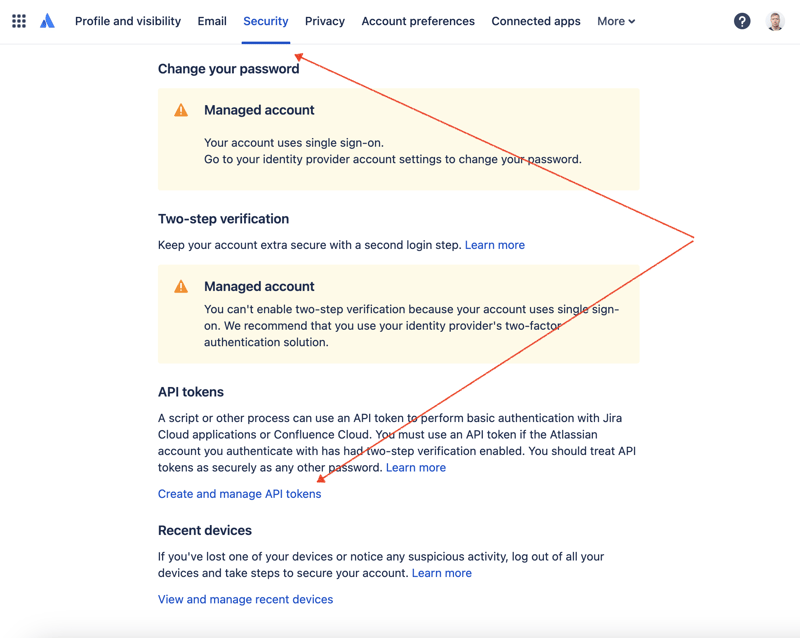
まず、REST API 経由で JIRA にアクセスするための秘密キーを作成する必要があります。これを行うには、プロファイル管理 - https://id.atlassian.com/manage-profile/profile-and-visibility [セキュリティ] タブを選択すると、[API トークンの作成と管理] リンクが表示されます。
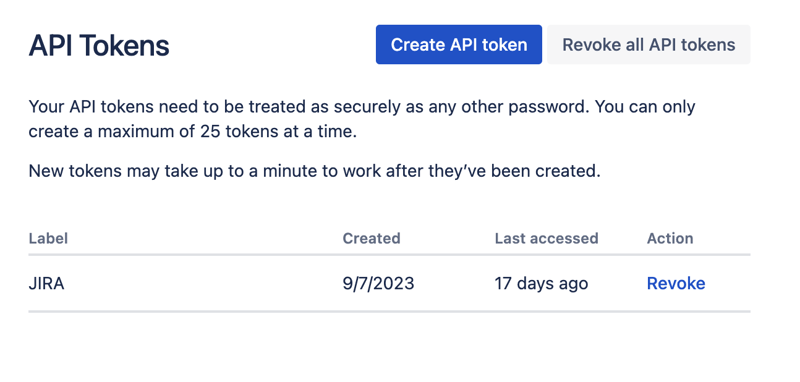
ここで新しい API トークンを作成し、安全に保存します。このトークンは後で使用します。
ジュピター ノートブック
データセットを操作する最も便利な方法の 1 つは、Jupyter を利用することです。このツールに慣れていない場合でも、心配する必要はありません。問題を解決するためにそれを使用する方法を説明します。ローカルでの実験には、JetBrains の DataSpell を使用するのが好きですが、オンラインで無料で利用できるサービスがあります。データサイエンティストの間で最もよく知られているサービスの 1 つは Kaggle です。ただし、ノートブックでは、外部接続を確立して API 経由で JIRA にアクセスすることはできません。もう 1 つの非常に人気のあるサービスは、Google の Colab です。これにより、リモート接続を確立し、追加の Python モジュールをインストールできます。
JIRA には非常に使いやすい REST API があります。 HTTP リクエストを実行する好みの方法を使用して API 呼び出しを行い、応答を手動で解析できます。ただし、その目的のために、優れた非常に人気のある jira モジュールを利用します。
動作中のツール
データ分析
すべてのパーツを組み合わせて解決策を考えてみましょう。
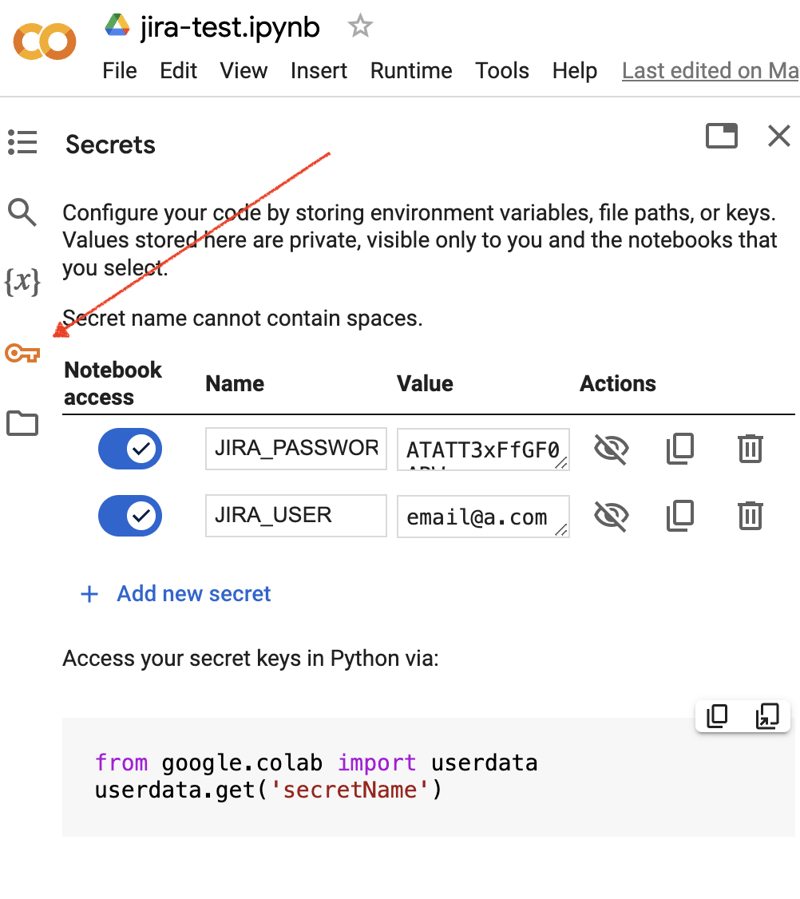
Google Colab インターフェースに移動し、新しいノートブックを作成します。ノートブックの作成後、以前に取得した JIRA 資格情報を「シークレット」として保存する必要があります。左側のツールバーの「キー」アイコンをクリックして適切なダイアログを開き、JIRA_USER と JIRA_PASSWORD という名前の 2 つの「シークレット」を追加します。画面の下部に、これらの「秘密」にアクセスする方法が表示されます:
次に、JIRA 統合用に追加の Python モジュールをインストールします。これを行うには、ノートブックのセルのスコープ内でシェル コマンドを実行します。
!pip install jira
出力は次のようになります:
Collecting jira
  Downloading jira-3.8.0-py3-none-any.whl (77 kB)
     ━━━━━━━━━━━━━━━━━━━━━━━━━━━━━━━━━━━━━━━━ 77.5/77.5 kB 1.3 MB/s eta 0:00:00
Requirement already satisfied: defusedxml in /usr/local/lib/python3.10/dist-packages (from jira) (0.7.1)
...
Installing collected packages: requests-toolbelt, jira
Successfully installed jira-3.8.0 requests-toolbelt-1.0.0
「シークレット」/認証情報を取得する必要があります:
from google.colab import userdata

JIRA_URL = 'https://******.atlassian.net'
JIRA_USER = userdata.get('JIRA_USER')
JIRA_PASSWORD = userdata.get('JIRA_PASSWORD')
そして、JIRA クラウドへの接続を検証します:
from jira import JIRA

jira = JIRA(JIRA_URL, basic_auth=(JIRA_USER, JIRA_PASSWORD))
projects = jira.projects()
projects
接続に問題がなく、認証情報が有効であれば、プロジェクトの空でないリストが表示されるはずです。
[<JIRA Project: key='PROJ1', name='Name here..', id='10234'>,
 <JIRA Project: key='PROJ2', name='Friendly name..', id='10020'>,
 <JIRA Project: key='PROJ3', name='One more project', id='10045'>,
...
これで、JIRA に接続してデータを取得できるようになります。次のステップは、pandas を使用して分析用のデータを取得することです。あるプロジェクトについて、過去数週間に解決された問題のリストを取得してみましょう:
JIRA_FILTER = 19762

issues = jira.search_issues(
    f'filter={JIRA_FILTER}',
    maxResults=False,
    fields='summary,issuetype,assignee,reporter,aggregatetimespent',
)
データセットを pandas データ フレームに変換する必要があります。
import pandas as pd

df = pd.DataFrame([{
    'key': issue.key,
    'assignee': issue.fields.assignee and issue.fields.assignee.displayName or issue.fields.reporter.displayName,
    'time': issue.fields.aggregatetimespent,
    'summary': issue.fields.summary,
} for issue in issues])

df.set_index('key', inplace=True)

df
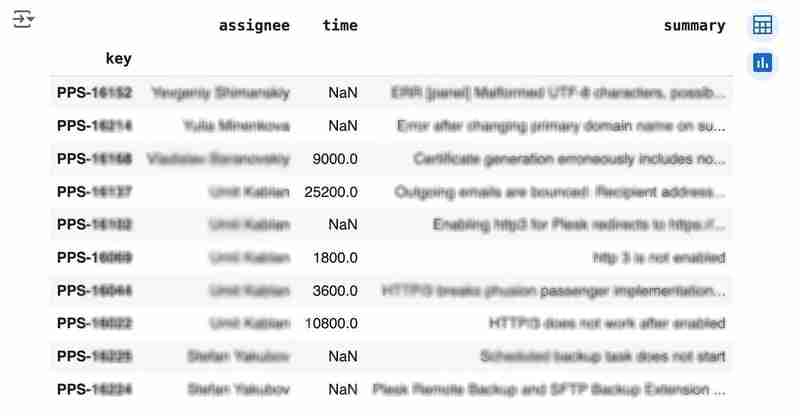
出力は次のようになります:
We would like to analyze how much time it usually takes to solve the issue. People are not ideal, so sometimes they forget to log the work. It brings a headache if you try to analyze such data using JIRA built-in tools. But it's not a problem for us to make some adjustments using pandas. For example, we can transform the "time" field from seconds into hours and replace the absent values with the median value (beware, dropna can be more suitable if there are a lot of gaps):
df['time'].fillna(df['time'].median(), inplace=True)
df['time'] = df['time'] / 3600
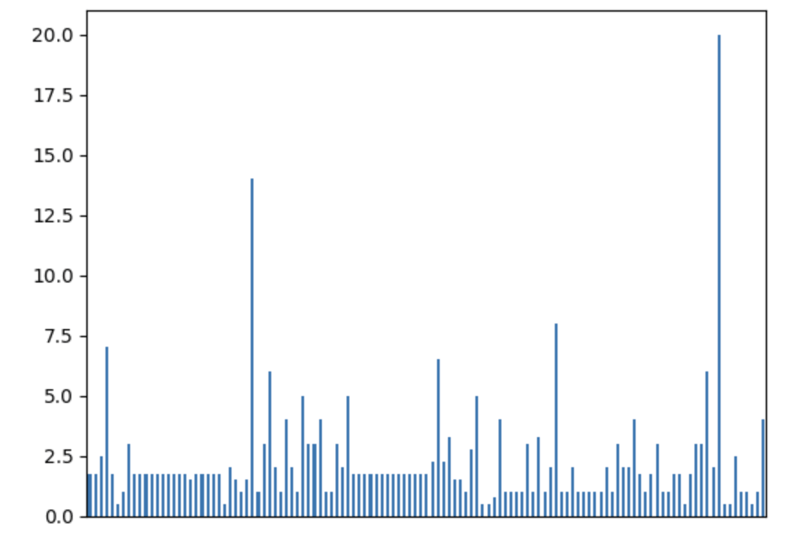
We can easily visualize the distribution to find out anomalies:
df['time'].plot.bar(xlabel='', xticks=[])
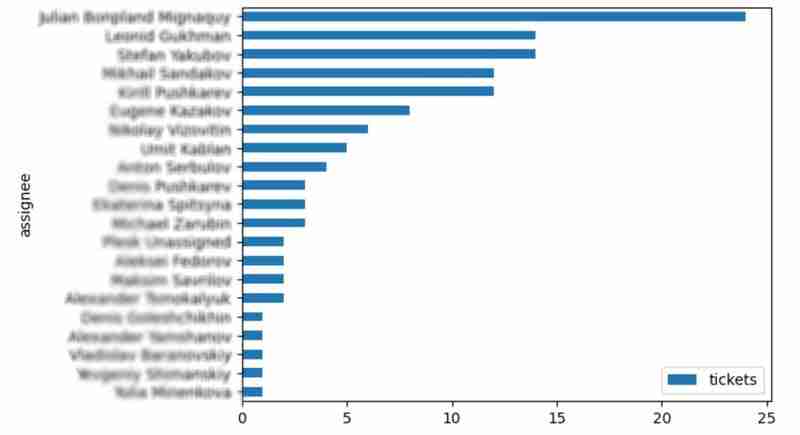
It is also interesting to see the distribution of solved problems by the assignee:
top_solvers = df.groupby('assignee').count()[['time']]
top_solvers.rename(columns={'time': 'tickets'}, inplace=True)
top_solvers.sort_values('tickets', ascending=False, inplace=True)

top_solvers.plot.barh().invert_yaxis()
It may look like the following:
Predictions
Let's try to predict the amount of time required to finish all open issues. Of course, we can do it without machine learning by using simple approximation and the average time to resolve the issue. So the predicted amount of required time is the number of open issues multiplied by the average time to resolve one. For example, the median time to solve one issue is 2 hours, and we have 9 open issues, so the time required to solve them all is 18 hours (approximation). It's a good enough forecast, but we might know the speed of solving depends on the product, team, and other attributes of the issue. If we want to improve the prediction, we can utilize machine learning to solve this task.
The high-level approach looks the following:
- Obtain the dataset for “learning”
- Clean up the data
- Prepare the "features" aka "feature engineering"
- Train the model
- Use the model to predict some value of the target dataset
For the first step, we will use a dataset of tickets for the last 30 weeks. Some parts here are simplified for illustrative purposes. In real life, the amount of data for learning should be big enough to make a useful model (e.g., in our case, we need thousands of issues to be analyzed).
issues = jira.search_issues(
    f'project = PPS AND status IN (Resolved) AND created >= -30w',
    maxResults=False,
    fields='summary,issuetype,customfield_10718,customfield_10674,aggregatetimespent',
)

closed_tickets = pd.DataFrame([{
    'key': issue.key,
    'team': issue.fields.customfield_10718,
    'product': issue.fields.customfield_10674,
    'time': issue.fields.aggregatetimespent,
} for issue in issues])

closed_tickets.set_index('key', inplace=True)
closed_tickets['time'].fillna(closed_tickets['time'].median(), inplace=True)

closed_tickets
In my case, it's something around 800 tickets and only two fields for "learning": "team" and "product."
The next step is to obtain our target dataset. Why do I do it so early? I want to clean up and do "feature engineering" in one shot for both datasets. Otherwise, the mismatch between the structures can cause problems.
issues = jira.search_issues(
    f'project = PPS AND status IN (Open, Reopened)',
    maxResults=False,
    fields='summary,issuetype,customfield_10718,customfield_10674',
)

open_tickets = pd.DataFrame([{
    'key': issue.key,
    'team': issue.fields.customfield_10718,
    'product': issue.fields.customfield_10674,
} for issue in issues])

open_tickets.set_index('key', inplace=True)

open_tickets
Please notice we have no "time" column here because we want to predict it. Let's nullify it and combine both datasets to prepare the "features."
open_tickets['time'] = 0
tickets = pd.concat([closed_tickets, open_tickets])

tickets
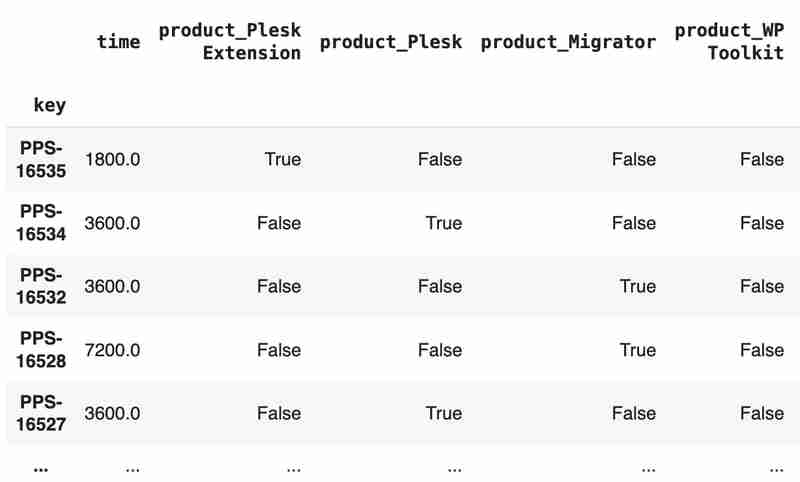
Columns "team" and "product" contain string values. One of the ways of dealing with that is to transform each value into separate fields with boolean flags.
products = pd.get_dummies(tickets['product'], prefix='product')
tickets = pd.concat([tickets, products], axis=1)
tickets.drop('product', axis=1, inplace=True)

teams = pd.get_dummies(tickets['team'], prefix='team')
tickets = pd.concat([tickets, teams], axis=1)
tickets.drop('team', axis=1, inplace=True)

tickets
The result may look like the following:
After the combined dataset preparation, we can split it back into two parts:
closed_tickets = tickets[:len(closed_tickets)]
open_tickets = tickets[len(closed_tickets):][:]
Now it's time to train our model:
from sklearn.model_selection import train_test_split
from sklearn.tree import DecisionTreeRegressor

features = closed_tickets.drop(['time'], axis=1)
labels = closed_tickets['time']

features_train, features_val, labels_train, labels_val = train_test_split(features, labels, test_size=0.2)

model = DecisionTreeRegressor()
model.fit(features_train, labels_train)
model.score(features_val, labels_val)
And the final step is to use our model to make a prediction:
open_tickets['time'] = model.predict(open_tickets.drop('time', axis=1, errors='ignore'))
open_tickets['time'].sum() / 3600
The final output, in my case, is 25 hours, which is higher than our initial rough estimation. This was a basic example. However, by using ML tools, you can significantly expand your abilities to analyze JIRA data.
Conclusion
Sometimes, JIRA built-in tools and plugins are not sufficient for effective analysis. Moreover, many 3rd party plugins are rather expensive, costing thousands of dollars per year, and you will still struggle to make them work the way you want. However, you can easily utilize well-known data analysis tools by fetching necessary information via JIRA API and go beyond these limitations. I spent so many hours playing with various JIRA plugins in attempts to create good reports for projects, but they often missed some important parts. Building a tool or a full-featured service on top of JIRA API also often looks like overkill. That's why typical data analysis and ML tools like Jupiter, pandas, matplotlib, scikit-learn, and others may work better here.

以上がPandas を使用した JIRA 分析の詳細内容です。詳細については、PHP 中国語 Web サイトの他の関連記事を参照してください。

