Maison >développement back-end >Tutoriel Python >Pandas+Pyecharts | Visualisation des données météorologiques historiques de Pékin au cours des cinq dernières années
Pandas+Pyecharts | Visualisation des données météorologiques historiques de Pékin au cours des cinq dernières années
- Python当打之年avant
- 2023-08-09 15:29:261009parcourir
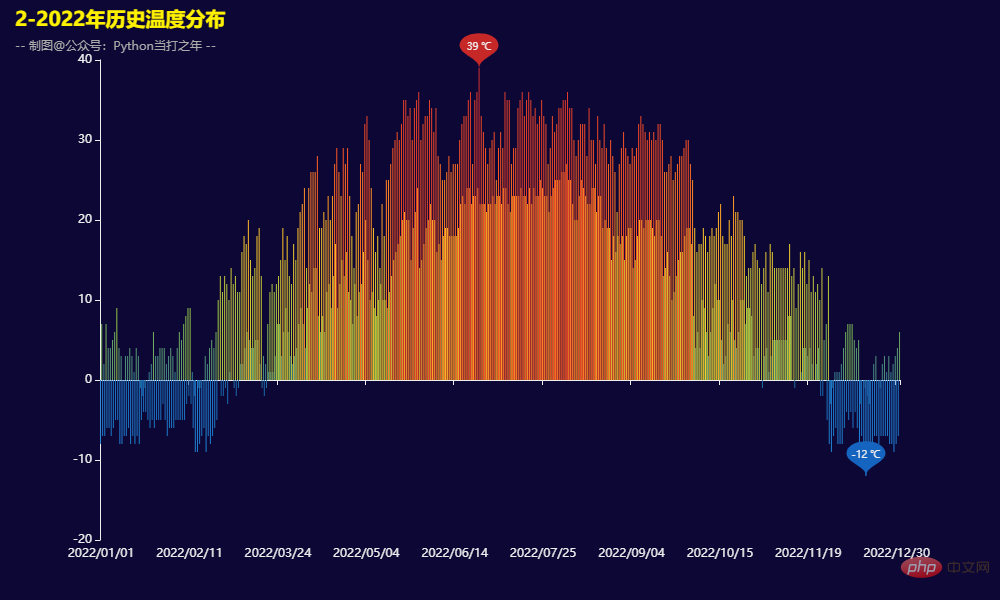
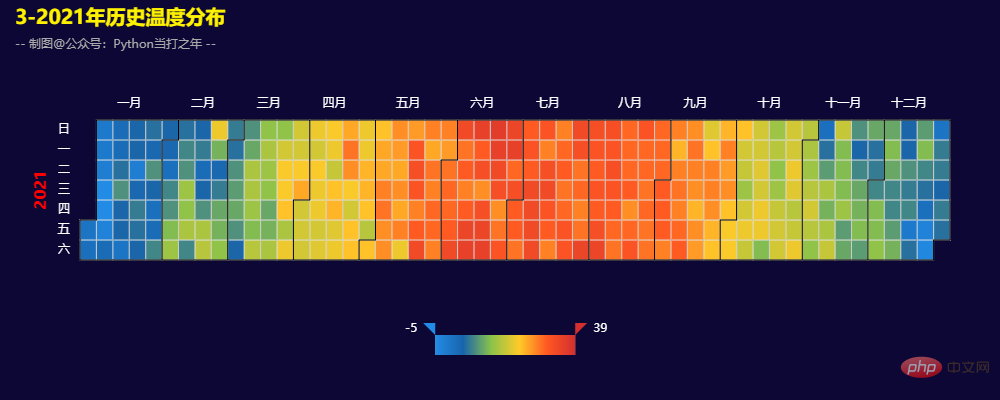
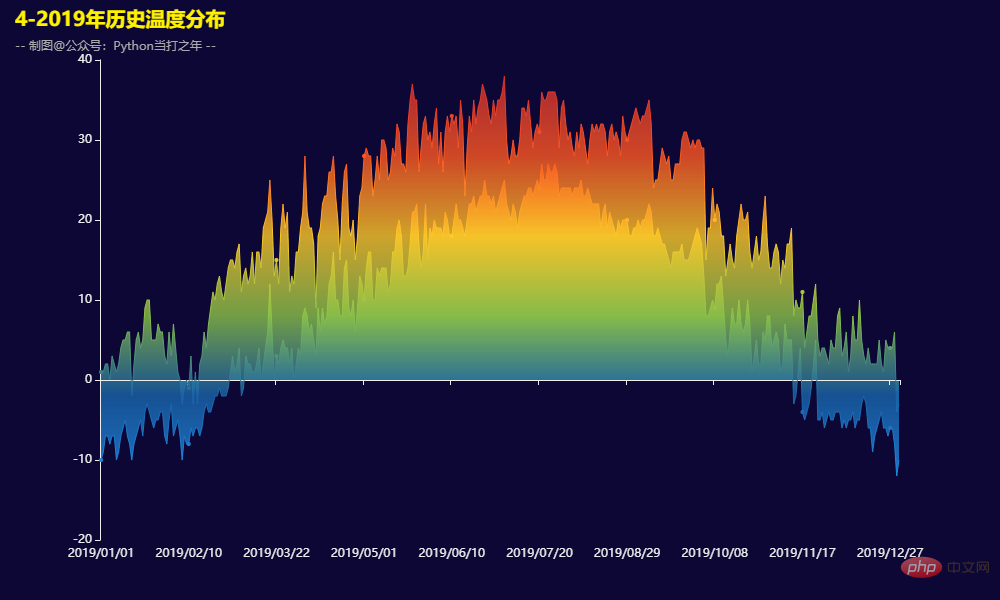
Ce numéro utilise la bibliothèque de visualisation pyecharts de Python pour dessiner les données météorologiques historiques de Pékin et jeter un œil aux hautes températures historiques, distribution historique des basses températures et énergie éolienne et direction de jour comme de nuit Distribution et autres situations , J'espère que cela sera utile à tout le monde. Si vous avez des questions ou des domaines à améliorer, vous pouvez contacter l'éditeur.
Bibliothèques impliquées :
Pandas — Traitement des données
Pyecharts — Visualisation des données
import pandas as pd
from pyecharts.charts import Line
from pyecharts.charts import Bar
from pyecharts.charts import Scatter
from pyecharts.charts import Pie
from pyecharts.charts import EffectScatter
from pyecharts.charts import Calendar
from pyecharts.charts import Polar
from pyecharts import options as opts
import warnings
warnings.filterwarnings('ignore')
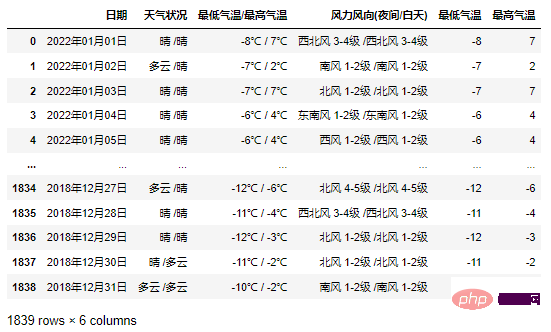
df_weather_1 = df_weather.copy()
df_weather_1[['最低气温','最高气温']] = df_weather_1['最低气温/最高气温'].str.split(' / ',expand=True)
df_weather_1['最低气温'] = df_weather_1['最低气温'].str[:-2]
df_weather_1['最高气温'] = df_weather_1['最高气温'].str[:-1]
df_weather_1['最低气温'] = df_weather_1['最低气温'].astype('int')
df_weather_1['最高气温'] = df_weather_1['最高气温'].astype('int')
2.3 处理日期数据
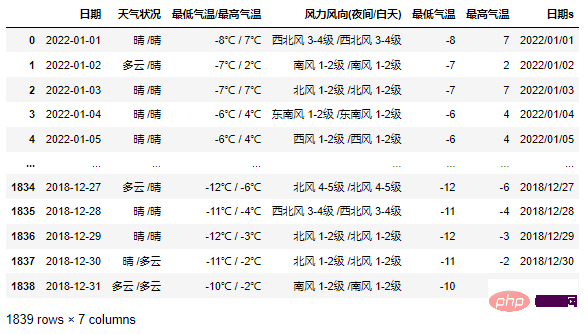
df_weather_1['日期'] = pd.to_datetime(df_weather_1['日期'],format='%Y年%m月%d日')
df_weather_1['日期s'] = df_weather_1['日期'].dt.strftime('%Y/%m/%d')
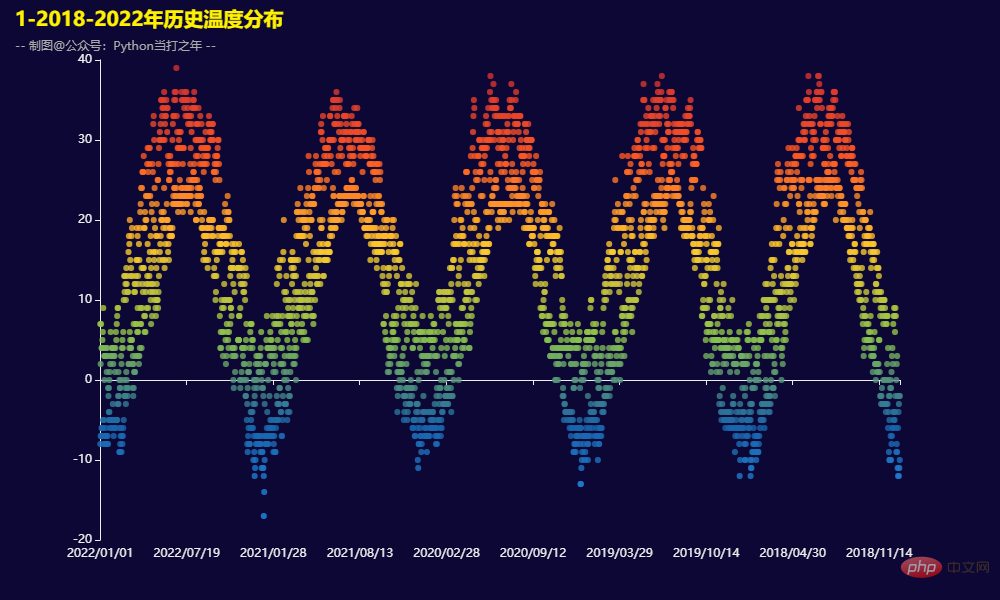
def get_scatter():
    scatter = (
        Scatter()
        .add_xaxis(x_data)
        .add_yaxis("最低气温", y_data1)
        .add_yaxis("最高气温", y_data2)
        .set_global_opts(
            legend_opts=opts.LegendOpts(is_show=False),
            visualmap_opts=opts.VisualMapOpts(
                is_show=False,
                range_color=range_color
            ),
            title_opts=opts.TitleOpts(
                title='1-2018-2022年历史温度分布',
                subtitle='-- 制图@公众号:Python当打之年 --',
                pos_top='1%',
                pos_left="1%",
            )
        )
    )
def get_calendar():
    calendar = (
        Calendar()
        .add('',
             data_21,
             calendar_opts=opts.CalendarOpts(
                 pos_right='5%',
                 range_='2021',
                daylabel_opts=opts.CalendarDayLabelOpts(name_map='cn'),
                monthlabel_opts=opts.CalendarMonthLabelOpts(name_map='cn')
             ),
        )
        .set_global_opts(
            title_opts=opts.TitleOpts(
                title='3-2021年历史温度分布',
                subtitle='-- 制图@公众号:Python当打之年 --',
                pos_top='1%',
                pos_left="1%",
            ),
            visualmap_opts=opts.VisualMapOpts(
                range_color=range_color,
            )
        )
    )
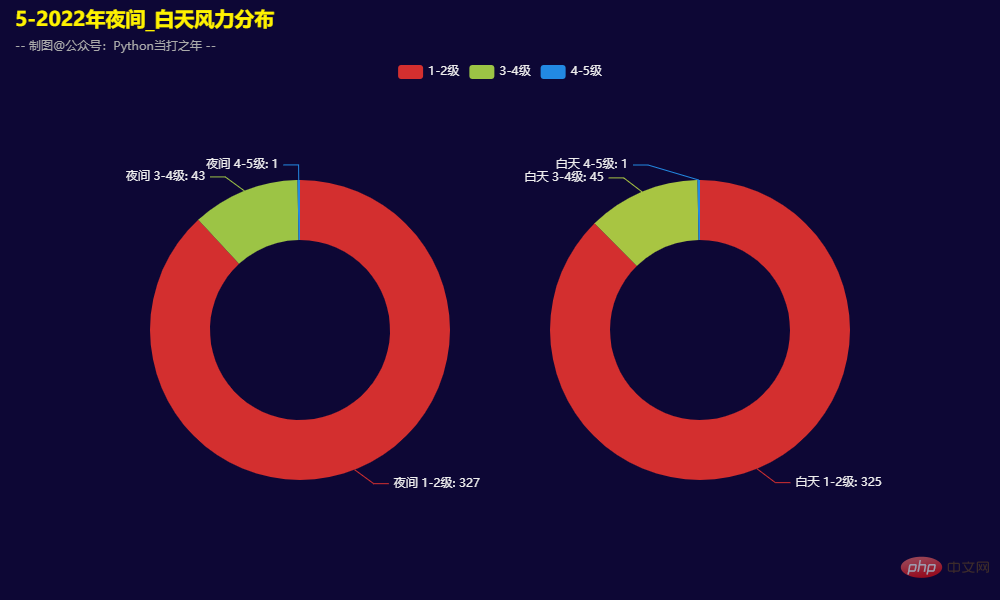
3.5 2022年夜间_白天风力分布
def get_pie():
    pie = (
        Pie()
        .add(
            "",
            [list(z) for z in zip(x_data, y_data1)],
            radius=["30%", "50%"],
            center=["30%", "55%"],
        )
        .add(
            "",
            [list(z) for z in zip(x_data, y_data2)],
            radius=["30%", "50%"],
            center=["70%", "55%"],
        )
        .set_global_opts(
            title_opts=opts.TitleOpts(
                title='5-2022年夜间_白天风力分布',
                subtitle='-- 制图@公众号:Python当打之年 --',
                pos_top='1%',
                pos_left="1%",
            ),
            legend_opts=opts.LegendOpts(pos_top='10%'),
            visualmap_opts=opts.VisualMapOpts(
                is_show=False,
                range_color=range_color
            ),
        )
    )
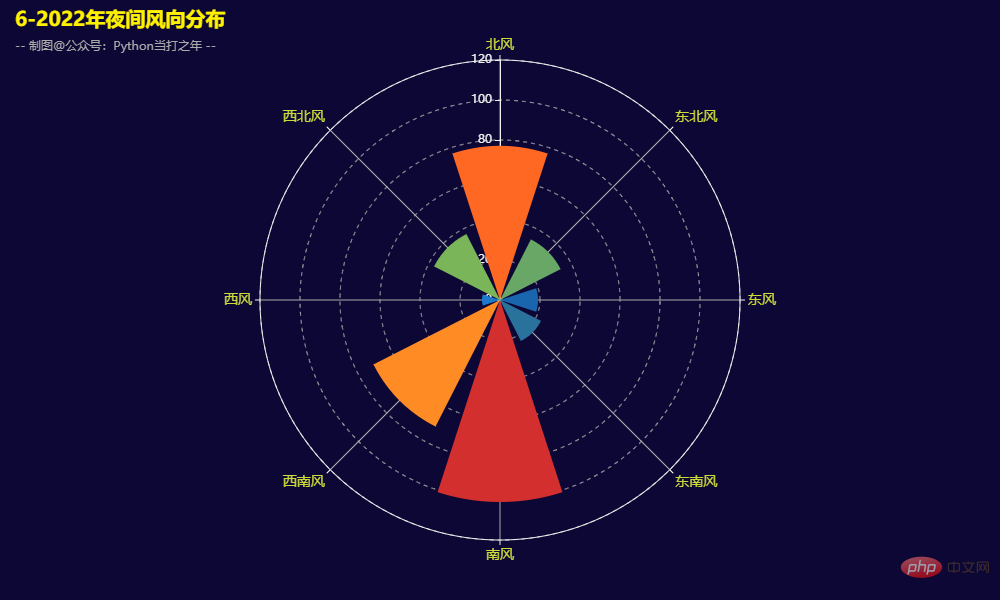
def get_polor():
    polor = (
        Polar()
        .add("", values,type_="bar")
        .set_global_opts(
            legend_opts=opts.LegendOpts(is_show=False),
            visualmap_opts=opts.VisualMapOpts(
                is_show=False,
                range_color=range_color
            ),
            title_opts=opts.TitleOpts(
                title='6-2022年夜间风向分布',
                subtitle='-- 制图@公众号:Python当打之年 --',
                pos_top='1%',
                pos_left="1%",
            ),
        )
    )
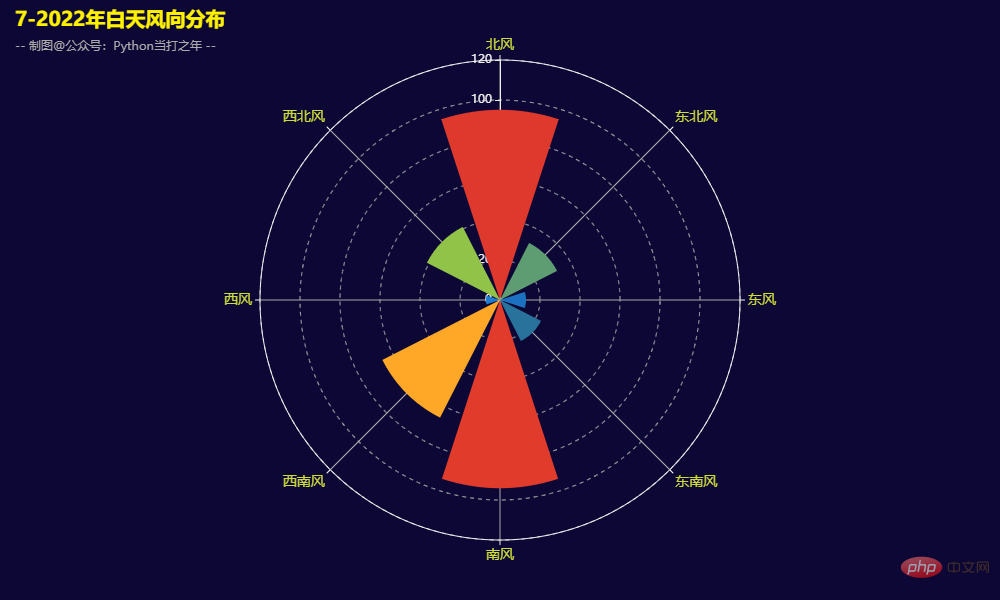
3.7 2022年白天风向分布
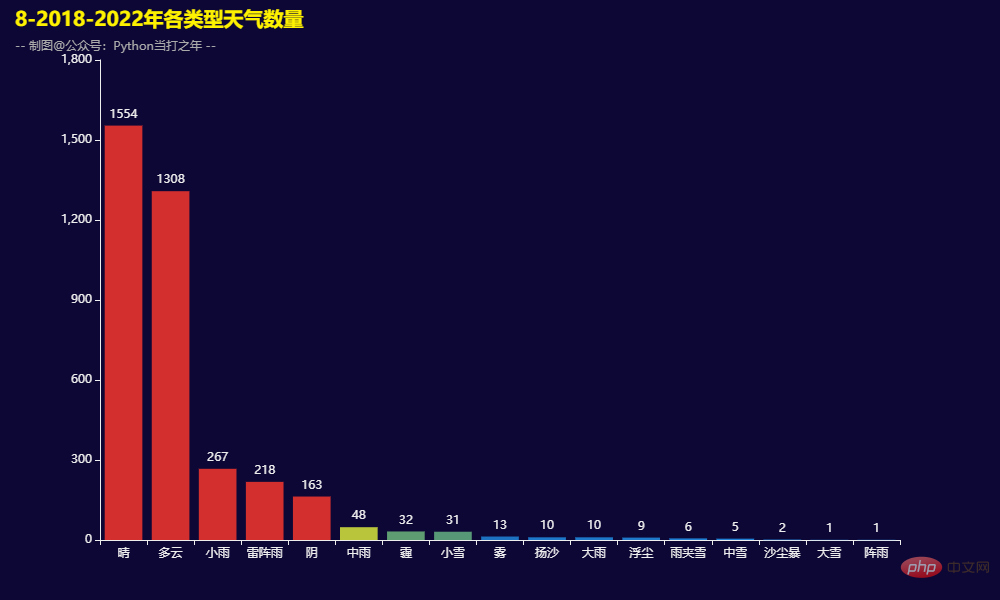
3.8 2018-2022年各类型天气数量
def get_bar():
    bar = (
        Bar()
        .add_xaxis(x_data)
        .add_yaxis("",y_data)
        .set_global_opts(
            visualmap_opts=opts.VisualMapOpts(
                is_show=False,
                range_color=range_color
            ),
            legend_opts=opts.LegendOpts(is_show=False),
            title_opts=opts.TitleOpts(
                title='8-2018-2022年各类型天气数量',
                subtitle='-- 制图@公众号:Python当打之年 --',
                pos_top='1%',
                pos_left="1%",
            ),
        )
    )
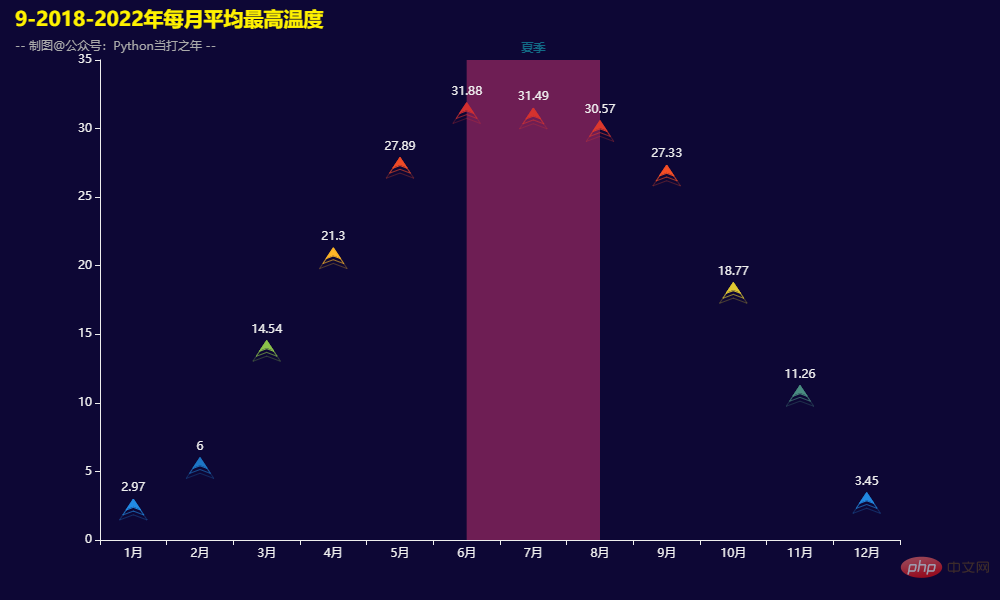
3.9 2018-2022年每月平均最高温度
Ce qui précède est le contenu détaillé de. pour plus d'informations, suivez d'autres articles connexes sur le site Web de PHP en chinois!
Articles Liés
Voir plus- Utilisez pandas pour lire les premières lignes spécifiées dans le fichier csv
- Lire des fichiers CSV à l'aide de pandas
- Explication détaillée de read_excel dans Python 2.7 pandas
- Comment filtrer les données dans les pandas en fonction d'une combinaison de plusieurs colonnes
- Explication détaillée de la façon dont Python utilise Pandas pour l'analyse des données

