Maison >interface Web >Questions et réponses frontales >Comment utiliser vue pour implémenter un histogramme
Comment utiliser vue pour implémenter un histogramme
- 藏色散人original
- 2023-01-29 14:12:222751parcourir
Comment utiliser vue pour implémenter un histogramme : 1. Créez un div avec l'attribut "
" 2. Via " Mounted() {this.fetchData()window.addEventListener('resize',()=>{if (this.chart){...}" peut réaliser l'histogramme tridimensionnel.

Le environnement d'exploitation de ce tutoriel : système Windows 10, version vue3, ordinateur DELL G3
Comment utiliser vue pour implémenter un histogramme
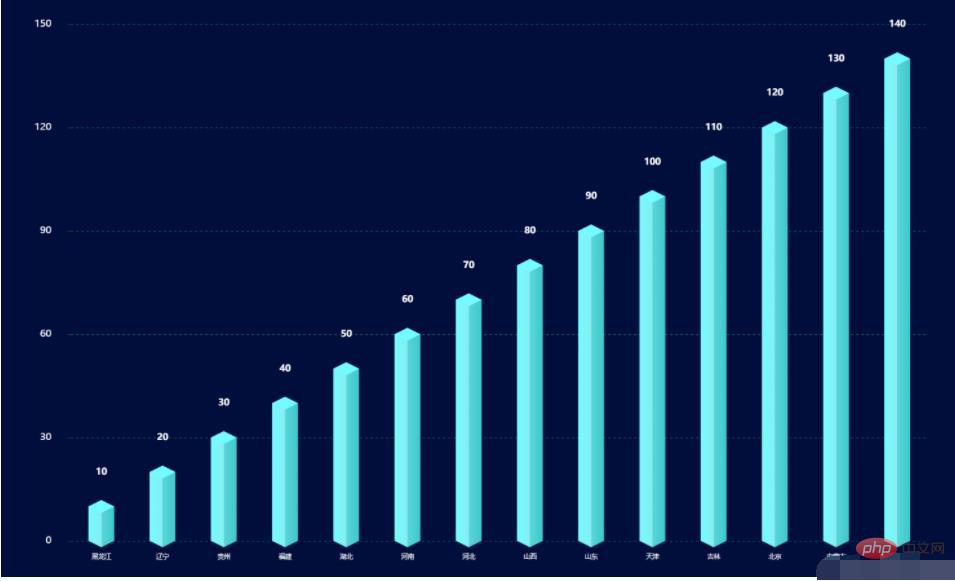
vue implémente un histogramme tridimensionnel
Le style est comme indiqué ? ci-dessous : 
Vous pouvez penser à un histogramme tridimensionnel car il est composé de yData+bottom+top, et le code correspondant est le suivant :
<template>
  <div></div></template>
<script>import echarts from 'echarts'export default {
data() {
return {
chart: null,
data: [], //数据
xData: [], //x轴
yBarData: [], //y轴
yLable: [],
colorStops: [],
chartLegend: [], //图例
colorOptions: [ //图例以及柱形图颜色选择
'#5ba2e4',
'#f58510',
'#afa5a5',
'#facb3d',
'#0854cf',
'#48c611',
'#082b63'
]
}
},
mounted() {
this.fetchData()
//图的大小自适应
window.addEventListener('resize',()=>{
if (this.chart){
this.chart.resize()
}
})
},
beforeDestroy() { //实例销毁之前调用
if (!this.chart) {
return
}
this.chart.dispose()
this.chart = null
},
methods: {
fetchData() {
this.xData = ["黑龙江",'辽宁','贵州','福建','湖北','河南','河北','山西','山东','天津','吉林','北京','内蒙古','云南']
this.yLable = ['10','20','30','40','50','60','70','80','90','100','110','120','130','140']
this.chartLegend = []
const dateArr = []
this.yLable.forEach((item, index) => {
if (item !== null && item !== undefined) {
dateArr.push(this.yLable[index])
}
})
this.chartLegend = dateArr this.initData()
this.initChart()
},
initData() {
this.yBarData = this.yLable },
initChart() {
this.chart = echarts.init(this.$refs.BarChart)
this.chart.clear() // 清空当前实例
let colors = []
const dom = 800
const barWidth = dom / 20
for (let i = 0; i < 4; i++) {
colors.push({
colorStops: [
{
offset: 0,
color: '#73fcff' // 最左边
}, {
offset: 0.5,
color: '#86eef1' // 左边的右边 颜色
}, {
offset: 0.5,
color: '#5ad6d9' // 右边的左边 颜色
}, {
offset: 1,
color: '#3dc8ca'
}]
})
}
this.chart.setOption({
backgroundColor: '#010d3a',
//提示框
tooltip: {
trigger: 'axis',
formatter: "{b} : {c}",
axisPointer: { // 坐标轴指示器,坐标轴触发有效
type: 'shadow' // 默认为直线,可选为:'line' | 'shadow'
}
},
/**区域位置*/
grid: {
left: '10%',
right: '10%',
top: '10%',
bottom: '10%',
},
//X轴
xAxis: [{
data: this.xData,
type: 'category',
show: true,
axisLine: {
show: false,
lineStyle: {
color: 'rgba(255,255,255,1)',
shadowColor: 'rgba(255,255,255,1)',
// shadowOffsetX: '20'
},
symbol: ['none', 'arrow'],
symbolOffset: [0, 25]
},
splitLine: {
show: false
},
axisTick: {
show: false
},
axisLabel: {
margin: 20,
fontSize: 10
}
}],
yAxis: {
show: true,
splitNumber: 4,
axisLine: {
show: false
},
splitLine: {
show: true,
lineStyle: {
type: 'dashed',
color: '#075858'
},
},
axisLabel: {
show: true,
color: '#FFFFFF',
margin: 30,
fontSize: 15
}
},
series: [
{//数据颜色
name: '日付费用户数',
type: 'bar',
barWidth: barWidth,
itemStyle: {
normal: {
color: (params) => {
return colors[params.dataIndex % 4];
}
}
},
label: {
show: true,
position: [barWidth / 2, -(barWidth + 20)],
color: '#ffffff',
fontSize: 14,
fontStyle: 'bold',
align: 'center'
},
data: this.yBarData },
{//底
z: 2,
type: 'pictorialBar',
data: this.yBarData,
symbol: 'diamond',
symbolOffset: [0, '50%'],
symbolSize: [barWidth, barWidth * 0.5],
itemStyle: {
normal: {
color: (params) => {
return colors[params.dataIndex % 4]
}
}
}
},
{//顶
z: 3,
type: 'pictorialBar',
symbolPosition: 'end',
data: this.yBarData,
symbol: 'diamond',
symbolOffset: [0, '-50%'],
symbolSize: [barWidth, barWidth * 0.5],
itemStyle: {
normal: {
borderWidth: 0,
color: (params) => {
return colors[params.dataIndex % 4].colorStops[0].color;
}
}
}
}
]
}, true)
}
}}</script>
Dans le code js ci-dessus, il y a les précautions suivantes :
- Sélection des couleurs : vous pouvez remplacer
colors[params.dataIndex % 4]par this.colorOptions[params.dataIndex % 4], c'est-à-dire en utilisant les colorOptions définies dans le code pour le remplissage des couleurscolors[params.dataIndex % 4]替换为this.colorOptions[params.dataIndex % 4],即使用代码中定义的colorOptions进行颜色填充 - colorStops保证了立体的效果
- 代码中
colors[params.dataIndex % 4]中的4的选取是可变的,保证索引值在colors变量的长度范围内。例如:本例中colors长度为4,params.dataIndex % 4colorStops assure un effet tridimensionnel
colors[params.dataIndex % 4] dans le code La sélection de 4 dans est variable, garantissant que la valeur de l'index est comprise dans la plage de longueur de la variable de couleurs. Par exemple : dans cet exemple, la longueur des couleurs est de 4, et params.dataIndex % 4 ne dépasse pas 4. Juste
Pour citer le graphique à barres ci-dessus, vous pouvez appliquer le code suivant : <template>
<bar-chart></bar-chart></template>
<script>import barChart from "./components/barChart"export default {
name: 'barchart',
components: { barChart }}</script>
Ce qui précède est le contenu détaillé de. pour plus d'informations, suivez d'autres articles connexes sur le site Web de PHP en chinois!
Articles Liés
Voir plus- Partage d'exemples de dessin de graphiques de tendance boursière et d'histogrammes avec PHP
- Exemples d'affectation dynamique ajax de graphiques électroniques (camemberts et histogrammes)
- Explication graphique et textuelle détaillée du diagramme circulaire et du diagramme à colonnes dynamiques utilisant ajax
- Comment obtenir un effet de histogramme en utilisant du CSS pur ? (exemple de code)
- Exemple de code CSS pour obtenir un effet de graphique à colonnes

