Maison >développement back-end >Tutoriel Python >Une collection d'exemples de méthodes de binarisation pour le traitement d'images Python
Une collection d'exemples de méthodes de binarisation pour le traitement d'images Python
- coldplay.xixiavant
- 2020-07-27 17:10:502761parcourir

Lors de l'utilisation de Python pour le traitement d'images, la binarisation est une étape très importante. J'ai maintenant résumé 6 méthodes de binarisation d'images que j'ai rencontrées (bien sûr, ce n'est certainement pas le cas. Toutes les méthodes de binarisation continueront. à ajouter si de nouvelles méthodes sont découvertes).
Recommandations d'apprentissage associées : Tutoriel vidéo Python
1. Seuil simple opencv cv2.threshold
2. cv2.adaptiveThreshold (Il existe deux méthodes pour calculer les seuils dans les seuils adaptatifs : mean_c et guassian_c. Vous pouvez essayer laquelle est la meilleure)
3. Binarisation d'Otsu
Exemple :
import cv2
import numpy as np
from matplotlib import pyplot as plt

img = cv2.imread('scratch.png', 0)
# global thresholding
ret1, th1 = cv2.threshold(img, 127, 255, cv2.THRESH_BINARY)
# Otsu's thresholding
th2 = cv2.adaptiveThreshold(img, 255, cv2.ADAPTIVE_THRESH_MEAN_C, cv2.THRESH_BINARY, 11, 2)
# Otsu's thresholding
# 阈值一定要设为 0 !
ret3, th3 = cv2.threshold(img, 0, 255, cv2.THRESH_BINARY + cv2.THRESH_OTSU)
# plot all the images and their histograms
images = [img, 0, th1, img, 0, th2, img, 0, th3]
titles = [
  'Original Noisy Image', 'Histogram', 'Global Thresholding (v=127)',
  'Original Noisy Image', 'Histogram', "Adaptive Thresholding",
  'Original Noisy Image', 'Histogram', "Otsu's Thresholding"
]
# 这里使用了 pyplot 中画直方图的方法, plt.hist, 要注意的是它的参数是一维数组
# 所以这里使用了( numpy ) ravel 方法,将多维数组转换成一维,也可以使用 flatten 方法
# ndarray.flat 1-D iterator over an array.
# ndarray.flatten 1-D array copy of the elements of an array in row-major order.
for i in range(3):
  plt.subplot(3, 3, i * 3 + 1), plt.imshow(images[i * 3], 'gray')
  plt.title(titles[i * 3]), plt.xticks([]), plt.yticks([])
  plt.subplot(3, 3, i * 3 + 2), plt.hist(images[i * 3].ravel(), 256)
  plt.title(titles[i * 3 + 1]), plt.xticks([]), plt.yticks([])
  plt.subplot(3, 3, i * 3 + 3), plt.imshow(images[i * 3 + 2], 'gray')
  plt.title(titles[i * 3 + 2]), plt.xticks([]), plt.yticks([])
plt.show()
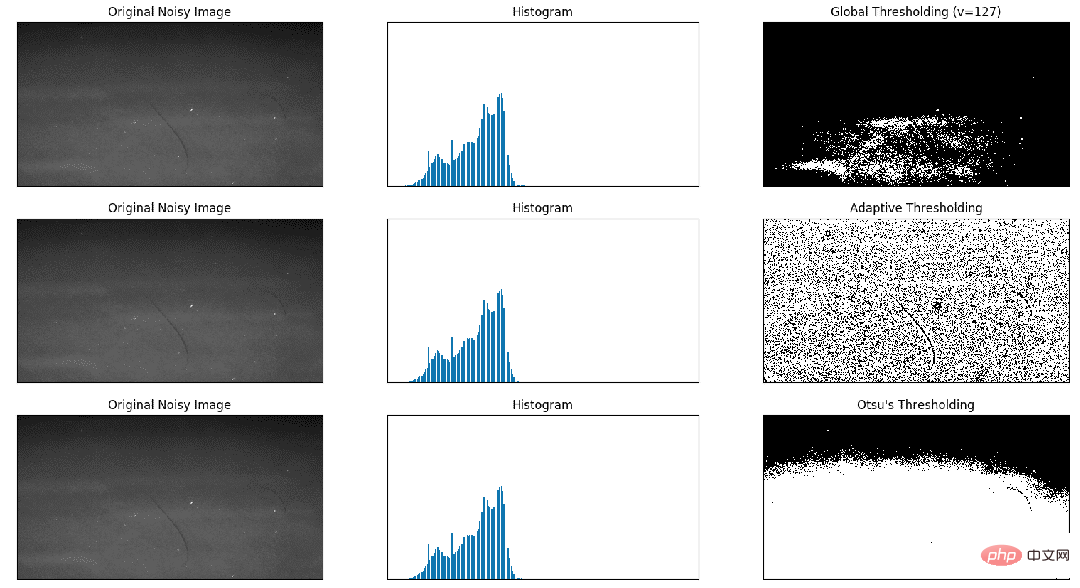
<.>Image du résultat :

import matplotlib
import matplotlib.pyplot as plt

from skimage.data import page
from skimage.filters import (threshold_otsu, threshold_niblack,
               threshold_sauvola)


matplotlib.rcParams['font.size'] = 9


image = page()
binary_global = image > threshold_otsu(image)

window_size = 25
thresh_niblack = threshold_niblack(image, window_size=window_size, k=0.8)
thresh_sauvola = threshold_sauvola(image, window_size=window_size)

binary_niblack = image > thresh_niblack
binary_sauvola = image > thresh_sauvola

plt.figure(figsize=(8, 7))
plt.subplot(2, 2, 1)
plt.imshow(image, cmap=plt.cm.gray)
plt.title('Original')
plt.axis('off')

plt.subplot(2, 2, 2)
plt.title('Global Threshold')
plt.imshow(binary_global, cmap=plt.cm.gray)
plt.axis('off')

plt.subplot(2, 2, 3)
plt.imshow(binary_niblack, cmap=plt.cm.gray)
plt.title('Niblack Threshold')
plt.axis('off')

plt.subplot(2, 2, 4)
plt.imshow(binary_sauvola, cmap=plt.cm.gray)
plt.title('Sauvola Threshold')
plt.axis('off')

plt.show()
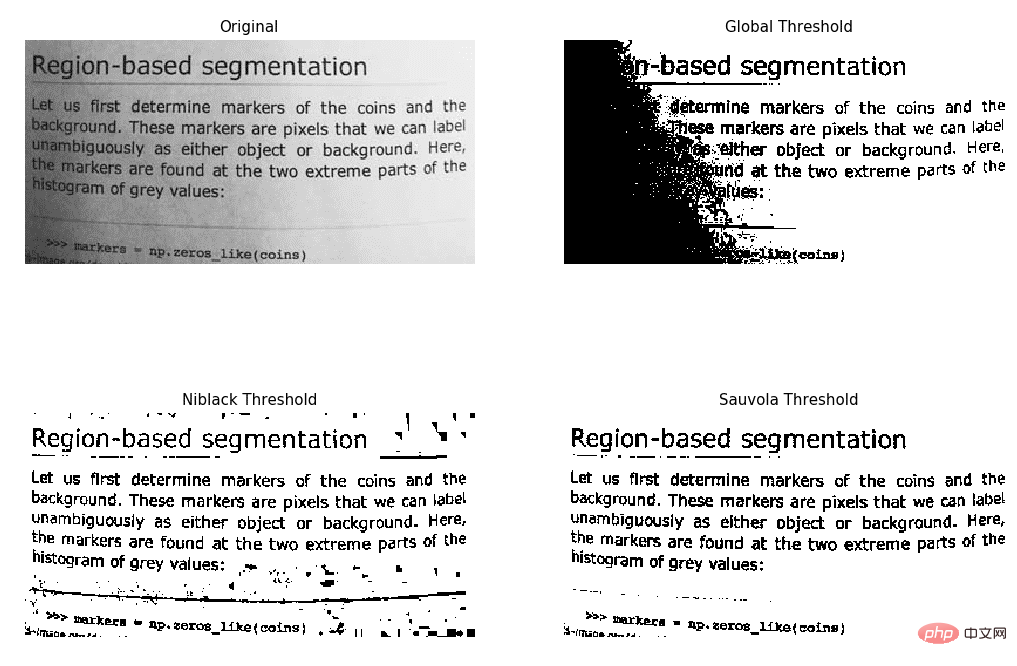
Graphique des résultats : 

Ce qui précède est le contenu détaillé de. pour plus d'informations, suivez d'autres articles connexes sur le site Web de PHP en chinois!

