
Maison >interface Web >js tutoriel >Explication graphique détaillée de l'utilisation de vue2-highcharts dans Vue
Explication graphique détaillée de l'utilisation de vue2-highcharts dans Vue
- php中世界最好的语言original
- 2018-03-28 14:34:426033parcourir
Cette fois, je vais vous apporter une explication détaillée de l'utilisation de vue2-highcharts dans Vue avec des images et des textes. Quelles sont les précautions pour utiliser vue2-highcharts dans Vue. Ce qui suit est un cas pratique. , jetons un coup d'oeil.
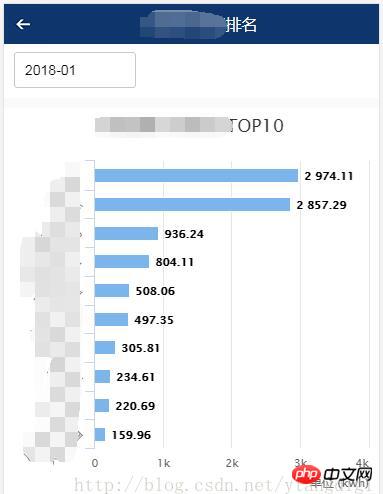
1. L'effet à obtenir est le suivant :
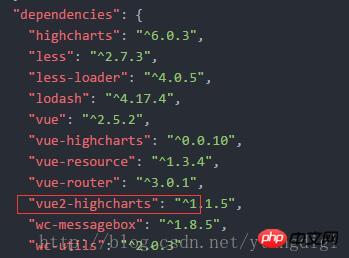
2. Tout d'abord, le projet fait référence à vue2-highcharts
package.json comme suit :
Entrez dans la ligne de commande :
cnpm install vue2-highcharts
3. Le code de la page est le suivant :
<template>
<p >
<p>
<p id="transparent-header" class="rank-head container" >
<img src="../assets/index/back.png" class="rank-head-back" @click="routerBack"/>
<span >用能排名</span>
</p>
</p>
<p >
<p >
<datepicker v-on:picked="picked" style="margin-left:10px;"></datepicker>
</p>
<p >
</p>
</p>
<p >
<p class="charts">
<vue-highcharts :options="options" ref="maxLineCharts"></vue-highcharts>
</p>
</p>
<p >
<p class="charts">
<vue-highcharts :options="options" ref="minLineCharts"></vue-highcharts>
</p>
</p>
</p>
</template>
<script>
import datepicker from '../components/datepicker.vue'
import VueHighcharts from 'vue2-highcharts'
export default {
data() {
return{
topHeight:240,
freezeMon:'',
ownerFreeData: [],
options:{
credits: {
enabled: false
},
legend: {
enabled: false
},
global: {
useUTC: false
},
chart: {
type: 'bar'
},
title: {
text: ' '
},
subtitle: {
text: ''
},
xAxis:[{
categories: ['1', '2', '3', '4', '5','6', '7', '8', '9', '10'],
title: {
text: null
},
labels: {
rotation: -45
}
}],
yAxis:[{
min: 0,
labels:{
overflow: 'justify'
},
title: {
text: '单位 (kwh)',
align: 'high'
}
}],
tooltip: {
formatter: function(){
return this.x+':'+this.y+'kwh';
}
},
credits: {
enabled: false
},
plotOptions: {
bar: {
dataLabels: {
enabled: true
}
},
series: [{
type: 'bar'
}]
}
}
}
},
methods: {
picked(year, month, date) {
if(month < 10){
this.freezeMon = `${year}-0${month}`;
}else{
this.freezeMon = `${year}-${month}`;
}
this.getList();
},
routerBack(){
this.$router.go(-1);
},
getList(){
let maxLineCharts = this.$refs.maxLineCharts;
let minLineCharts = this.$refs.minLineCharts;
if(maxLineCharts != null && minLineCharts != null){
//移除所有Series
maxLineCharts.removeSeries();
minLineCharts.removeSeries();
//设置标题名
maxLineCharts.getChart().title.update({ text: '用能最大TOP10' });
minLineCharts.getChart().title.update({ text: '用能最小TOP10' });
var userType = sessionStorage.getItem('userType');
var areaCode = sessionStorage.getItem('areaCode');
this.$http.post(this.URLINFO + '/mobile/rankingMonitor/getDayFreezeApp.do',{yearMonth:this.freezeMon,userType:userType,areaCode:areaCode})
.then(function (res) {
var seriesData = []
var categoriesData = []
for(var i = 0;i < res.data.max.length; i++) {
//maxLineCharts.addSeries({name:res.data.max[i][1],data: [{name: res.data.max[i][1],y:res.data.max[i][2]}]});
seriesData.push([res.data.max[i][1],res.data.max[i][2]]);
categoriesData.push(res.data.max[i][1]);
}
maxLineCharts.addSeries({name: '用能',data: seriesData});
maxLineCharts.getChart().xAxis[0].setCategories(categoriesData);
seriesData = []
categoriesData = []
for(var i = 0;i < res.data.min.length; i++) {
//minLineCharts.addSeries({name:res.data.min[i][1],data: [{name: res.data.min[i][1],y:res.data.min[i][2]}]});
seriesData.push([res.data.min[i][1],res.data.min[i][2]]);
categoriesData.push(res.data.min[i][1]);
}
minLineCharts.addSeries({name: '用能',data: seriesData});
minLineCharts.getChart().xAxis[0].setCategories(categoriesData);
})
.catch(function (error) {
this.$toast('查询排名信息异常');
});
}
}
},
components: {
datepicker,
VueHighcharts
},
mounted () {
this.getList()
}
}
</script>
<style>
*{margin:0;padding:0; list-style:none }
h1,h2,h3,h4,h5,h6{font-size:16px; font-weight:normal;}
.rank-head{
width: 100%;
height: 40px;
position:fixed;
background: -webkit-linear-gradient(top,rgba(0,0,0,.6),rgba(0,0,0,0));
z-index: 999;
color: #fff;
font-size: 16px;
text-align: center;
line-height: 40px;
}
.container{
width: 100%;
overflow: hidden
}
.rank-head-back{
display: block;
float: left;
width: 40px;
height: 40px;
background: url("../assets/index/back.png") no-repeat center center;
background-size: 100% 100%;
}
</style>
Je crois que vous maîtrisez la méthode après avoir lu le cas dans cet article. Pour des choses plus excitantes, veuillez prêter attention à php Chinois Autres articles connexes en ligne !
Lecture recommandée :
Comment publier un projet vue via le BAE de Baidu
@HostBinding() et @HostListener dans AngularJS ()Quelle est la différence
Ce qui précède est le contenu détaillé de. pour plus d'informations, suivez d'autres articles connexes sur le site Web de PHP en chinois!
Articles Liés
Voir plus- Une analyse approfondie du composant de groupe de liste Bootstrap
- Explication détaillée du currying de la fonction JavaScript
- Exemple complet de génération de mot de passe JS et de détection de force (avec téléchargement du code source de démonstration)
- Angularjs intègre l'interface utilisateur WeChat (weui)
- Comment basculer rapidement entre le chinois traditionnel et le chinois simplifié avec JavaScript et l'astuce permettant aux sites Web de prendre en charge le basculement entre les compétences en chinois simplifié et traditionnel_javascript