
 Web Front-endJS TutorialBreakpoint settings and debugging tips for debugging JavaScript using Chrome_javascript tips
Breakpoint settings and debugging tips for debugging JavaScript using Chrome_javascript tips

How do you debug JavaScript programs? The most primitive method is to use alert() to print content on the page, and a slightly improved method is to use console.log() to output content on the JavaScript console. Well~, these two methods have indeed solved the debugging problems of many small JavaScript scripts. But it would be a shame to leave Chrome’s increasingly powerful developer tools unused. This article mainly introduces the JavaScript breakpoint setting and debugging functions, which is the Sources Panel (formerly called Scripts). If you are proficient in various Java debugging techniques in Eclipse, the concepts here are similar. The Chrome version used at the time of writing this article is 25.0.1364.172.
Basic environment

The left side of SourcesPanel is the content source, including various resources in the page. Among them, they are divided into Sources and Content scripts. Sources are the various resources contained in the page itself. They are organized according to the domains that appear on the page. This is what we want to focus on. Asynchronously loaded js files will also appear here after loading. Content scripts are an extension of Chrome. They are organized according to the extension ID. Such extensions are actually resources embedded in the page. They can also read and write the DOM. Developers who write and debug such extensions need to care about them. If your browser does not have any extensions installed, Content scripts will not see anything.
The middle main area of the Sources Panel is used to display the content of the resource files on the left.
The right side of the Sources Panel is the debugging ribbon. The top row of buttons are pause/continue, single-step execution, single-step in, single-step out, and disable/enable all breakpoints. Below are various specific functional areas. Introduced later.
Note that the left and right areas may be shrunk by default and not displayed on both sides. Click the retract buttons on both sides 
 to display them. The area on the left is automatically shrunk by default when displayed. Clicking the pin button
  next to it will not shrink it.
There are also some useful function buttons at the bottom.
Set a breakpoint on the source code
Open the corresponding JavaScript file through the content source on the left, and click the line number of the file to set and delete breakpoints. Each breakpoint added will appear in the Breakpoints list in the debugging area on the right. Clicking on the breakpoint in the list will locate the breakpoint in the content area. If you have multiple files and multiple breakpoints, it is very convenient to use the breakpoints in the Breakpoints list to quickly locate them.

For each added breakpoint there are two states: activated and disabled. The breakpoints just added are all in the activated state, and the disabled state means that the breakpoint is retained but the breakpoint function is temporarily cancelled. There is a checkbox in front of each breakpoint in the Breakpoints list. Unchecking it will disable the breakpoint. Breakpoints can also be disabled in the right-click menu of the breakpoint location. You can also temporarily disable all added breakpoints on the  button on the right ribbon, and click again to restore the original state.
Conditional breakpoint: Select "Edit Breakpoint..." in the right-click menu of the breakpoint location to set the conditions for triggering the breakpoint, which is to write an expression and trigger it only when the expression is true breakpoint. View the environment call stack (Call Stack) of the breakpoint: When the breakpoint stops, the Call Stack in the debugging area on the right will display the method call stack where the current breakpoint is located. For example, there is a function g() which calls a function f(), and I set a breakpoint in f(), then the breakpoint will be triggered when I execute the function g() in the console, and the call stack is displayed as follows:
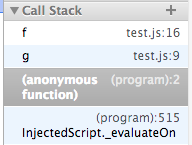
The top is f(), then g(). Each layer in the call stack is called a frame. Click on each frame to jump to the call point of the frame.
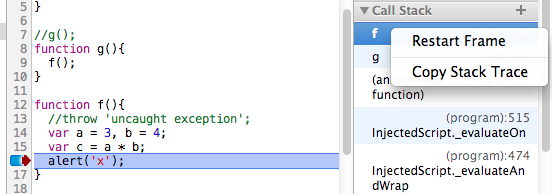
In addition, you can also use the right-click menu on the frame to restart execution of the current frame, that is, execute from the beginning of the frame. For example, if you restart Frame on the frame of function f(), the breakpoint will jump to the beginning of f() and re-executed, and the variable values in the context will also be restored. In this way, combined with functions such as variable modification and code editing, you can repeatedly debug in the current frame without refreshing the page and triggering breakpoints again. View variables
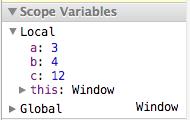
Below the Call Stack list is the Scope Variables list, where you can view the values of local variables and global variables at this time. Execute selected code

When debugging breakpoints, you can use the mouse to select the variable or expression you want to view, and then right-click the menu and execute "Evaluate in Console" to see the current value of the expression. Interrupt the JavaScript statement to be executed next time. The "Interrupt/Continue" button on the right side of the debugging area also has a function. When the breakpoint is not triggered, clicking this button will enter the "prepare" interrupt state. The next time the page Automatically interrupts when executing a JavaScript statement, such as code that is executed when a click action is triggered. Temporary modification of JavaScript code is usually used when debugging code: modify the code → refresh the page → recheck, such a cycle. But in fact, in Chrome, you can temporarily modify the contents of the JS file, save it (Ctrl S) and it will take effect immediately. Combined with functions such as Console, you can re-debug immediately. But please note that this modification is temporary and will be lost when you refresh the page.
Breakpoint on exception
You can see the  button at the bottom of the interface. It is a switch that sets whether to interrupt the program when it encounters an exception while running. Clicking this button will switch between 3 states:
By default, it will not interrupt when encountering exceptions
 Will interrupt when encountering all exceptions, including caught cases
 Break only on uncaught exception
Mainly explain the difference between state 2 and state 3
try{
throw 'a exception';
}catch(e){
console.log(e);
}
The code in the try above will encounter an exception, but the following catch code can catch the exception. If all exceptions are interrupted, then the code will automatically interrupt when it reaches the throw statement that generates an exception; and if it only interrupts when uncaught exceptions are encountered, then there will be no interruption here. Generally we are more concerned about encountering uncaught exceptions.
Set a breakpoint on a DOM element
Sometimes we need to monitor the modification of a certain DOM, regardless of which line of code is modified (it may be modified in multiple places). Then we can set breakpoints directly on the DOM.

As shown in the figure, in the Elements Panel of Element Inspection, you can set breakpoints in three different situations in the right-click menu on an element: the child node modifies its own attributes, modifies its own node, is deleted and selected, the middle right of the Sources Panel The DOM breakpoint will appear in the DOM Breakpoints list on the side. Once executed to make corresponding modifications to the DOM, the code will stop there, as shown in the figure below. 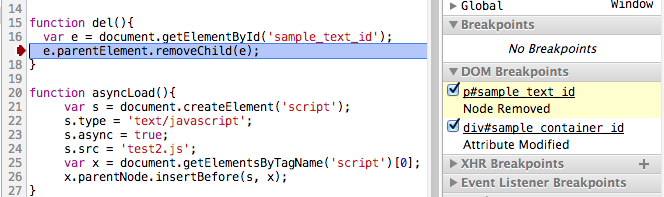
XHR Breakpoint
There is an XHR Breakpoints in the debugging area on the right. Click and enter the string contained in the URL to monitor the Ajax request of the URL. The input content is equivalent to the URL filter. If nothing is filled in, all XHR requests will be listened to. Once the XHR call is triggered it will break at request.send().
Trigger breakpoints by event type
Event Listener list in the debugging area on the right, various possible event types are listed here. Check the corresponding event type and it will automatically interrupt when the JavaScript code of this type of event is triggered.
Debugging shortcut keys
 The shortcut keys in all development tools can be found in the settings in the lower right corner of the interface. F8, F10, F11 or Shitf F11 are generally used for breakpoint debugging, but on Mac OS, function keys such as F10 may conflict with the system's default shortcut keys. It doesn't matter, they can be replaced by Cmd / , Cmd ' , Cmd ; , Shift Cmd ; respectively. //@ sourceURL Name the code generated by eval. Sometimes some very dynamic code is created in the current Javascript context in the form of a string through the eval() function, rather than being loaded as an independent js file. This way you won't be able to find the file in the content area on the left, making it difficult to debug. In fact, we only need to add a line "//@ sourceURL=name" to the end of the code created by eval to name this code (the browser will treat this special form of comment specially), so that it will Appears in the content area on the left, just like you loaded a js file with a specified name, and you can set breakpoints and debug. In the picture below, we execute a piece of code through eval and name it dynamicScript.js using sourceURL. After execution, this "file" appears in the left content area, and its content is the content in eval.
  You can also take a look at this example of naming dynamically compiled CoffeeScript code:
var coffee = CoffeeScript.compile(code.value) "//@ sourceURL=" (evalName.value || "Coffeeeeeeee!");
eval(coffee);
In fact, //@ sourceURL can be used not only in eval code, but also in any js file or even code entered in the Javascript Console, with the same effect! Format code (Pretty Print)  button is used to reformat messy code into beautiful code. For example, some compressed js files are basically impossible to read, let alone debug. Click once to format, and click again to cancel formatting.
  Before beautification
 Reference materials after beautification: Chrome Developer Tools official documentation

 From Websites to Apps: The Diverse Applications of JavaScriptApr 22, 2025 am 12:02 AM
JavaScript is widely used in websites, mobile applications, desktop applications and server-side programming. 1) In website development, JavaScript operates DOM together with HTML and CSS to achieve dynamic effects and supports frameworks such as jQuery and React. 2) Through ReactNative and Ionic, JavaScript is used to develop cross-platform mobile applications. 3) The Electron framework enables JavaScript to build desktop applications. 4) Node.js allows JavaScript to run on the server side and supports high concurrent requests.
 Python vs. JavaScript: Use Cases and Applications ComparedApr 21, 2025 am 12:01 AM
Python is more suitable for data science and automation, while JavaScript is more suitable for front-end and full-stack development. 1. Python performs well in data science and machine learning, using libraries such as NumPy and Pandas for data processing and modeling. 2. Python is concise and efficient in automation and scripting. 3. JavaScript is indispensable in front-end development and is used to build dynamic web pages and single-page applications. 4. JavaScript plays a role in back-end development through Node.js and supports full-stack development.
 The Role of C/C in JavaScript Interpreters and CompilersApr 20, 2025 am 12:01 AM
C and C play a vital role in the JavaScript engine, mainly used to implement interpreters and JIT compilers. 1) C is used to parse JavaScript source code and generate an abstract syntax tree. 2) C is responsible for generating and executing bytecode. 3) C implements the JIT compiler, optimizes and compiles hot-spot code at runtime, and significantly improves the execution efficiency of JavaScript.
 JavaScript in Action: Real-World Examples and ProjectsApr 19, 2025 am 12:13 AM
JavaScript's application in the real world includes front-end and back-end development. 1) Display front-end applications by building a TODO list application, involving DOM operations and event processing. 2) Build RESTfulAPI through Node.js and Express to demonstrate back-end applications.
 JavaScript and the Web: Core Functionality and Use CasesApr 18, 2025 am 12:19 AM
The main uses of JavaScript in web development include client interaction, form verification and asynchronous communication. 1) Dynamic content update and user interaction through DOM operations; 2) Client verification is carried out before the user submits data to improve the user experience; 3) Refreshless communication with the server is achieved through AJAX technology.
 Understanding the JavaScript Engine: Implementation DetailsApr 17, 2025 am 12:05 AM
Understanding how JavaScript engine works internally is important to developers because it helps write more efficient code and understand performance bottlenecks and optimization strategies. 1) The engine's workflow includes three stages: parsing, compiling and execution; 2) During the execution process, the engine will perform dynamic optimization, such as inline cache and hidden classes; 3) Best practices include avoiding global variables, optimizing loops, using const and lets, and avoiding excessive use of closures.
 Python vs. JavaScript: The Learning Curve and Ease of UseApr 16, 2025 am 12:12 AM
Python is more suitable for beginners, with a smooth learning curve and concise syntax; JavaScript is suitable for front-end development, with a steep learning curve and flexible syntax. 1. Python syntax is intuitive and suitable for data science and back-end development. 2. JavaScript is flexible and widely used in front-end and server-side programming.
 Python vs. JavaScript: Community, Libraries, and ResourcesApr 15, 2025 am 12:16 AM
Python and JavaScript have their own advantages and disadvantages in terms of community, libraries and resources. 1) The Python community is friendly and suitable for beginners, but the front-end development resources are not as rich as JavaScript. 2) Python is powerful in data science and machine learning libraries, while JavaScript is better in front-end development libraries and frameworks. 3) Both have rich learning resources, but Python is suitable for starting with official documents, while JavaScript is better with MDNWebDocs. The choice should be based on project needs and personal interests.


Hot AI Tools

Undresser.AI Undress
AI-powered app for creating realistic nude photos

AI Clothes Remover
Online AI tool for removing clothes from photos.

Undress AI Tool
Undress images for free

Clothoff.io
AI clothes remover

Video Face Swap
Swap faces in any video effortlessly with our completely free AI face swap tool!

Hot Article
Hot Tools

SecLists
SecLists is the ultimate security tester's companion. It is a collection of various types of lists that are frequently used during security assessments, all in one place. SecLists helps make security testing more efficient and productive by conveniently providing all the lists a security tester might need. List types include usernames, passwords, URLs, fuzzing payloads, sensitive data patterns, web shells, and more. The tester can simply pull this repository onto a new test machine and he will have access to every type of list he needs.

DVWA
Damn Vulnerable Web App (DVWA) is a PHP/MySQL web application that is very vulnerable. Its main goals are to be an aid for security professionals to test their skills and tools in a legal environment, to help web developers better understand the process of securing web applications, and to help teachers/students teach/learn in a classroom environment Web application security. The goal of DVWA is to practice some of the most common web vulnerabilities through a simple and straightforward interface, with varying degrees of difficulty. Please note that this software

SAP NetWeaver Server Adapter for Eclipse
Integrate Eclipse with SAP NetWeaver application server.

MinGW - Minimalist GNU for Windows
This project is in the process of being migrated to osdn.net/projects/mingw, you can continue to follow us there. MinGW: A native Windows port of the GNU Compiler Collection (GCC), freely distributable import libraries and header files for building native Windows applications; includes extensions to the MSVC runtime to support C99 functionality. All MinGW software can run on 64-bit Windows platforms.

Safe Exam Browser
Safe Exam Browser is a secure browser environment for taking online exams securely. This software turns any computer into a secure workstation. It controls access to any utility and prevents students from using unauthorized resources.

