


Example 1: Display in different colors
For example, now you need to add text here, but whether it is pure black or other colors, it does not feel as good-looking as the previous middle color or the outer color, then How to accomplish this?

Operation method: First, select the outer circle, second, select the text, and finally go to the format, select combination, and you are done,


Using this method, you can also solve similar problems, such as the combination of shapes, or the combination of shapes and pictures. These will not be explained one by one. You can try the operation several times. , then you will know.

Note that this combination is irreversible, that is, after the combination, it cannot be edited individually, it can only be modified as a whole, so you need to pay attention to this problem in advance.
Example 2: General display effect
For example, if you want to remove the number 20 and the following 0, then you can also refer to the previous example to achieve this effect. Complete an effect.

The operation method is: select to insert a rectangle, then select the digital text 20 first, then select the rectangular shape, and then select cut, and you are done. (Note that the order is different, use The functions are also different).


The above is the detailed content of How to make PPT showing half of the digital effect. For more information, please follow other related articles on the PHP Chinese website!

 How to use SUMIF function in Excel with formula examplesMay 13, 2025 am 10:53 AM
This tutorial explains the Excel SUMIF function in plain English. The main focus is on real-life formula examples with all kinds of criteria including text, numbers, dates, wildcards, blanks and non-blanks. Microsoft Excel has a handful o
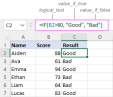 IF function in Excel: formula examples for text, numbers, dates, blanksMay 13, 2025 am 10:50 AM
In this article, you will learn how to build an Excel IF statement for different types of values as well as how to create multiple IF statements. IF is one of the most popular and useful functions in Excel. Generally, you use an IF statem
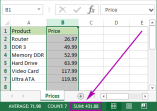 How to sum a column in Excel - 5 easy waysMay 13, 2025 am 09:53 AM
This tutorial shows how to sum a column in Excel 2010 - 2016. Try out 5 different ways to total columns: find the sum of the selected cells on the Status bar, use AutoSum in Excel to sum all or only filtered cells, employ the SUM function
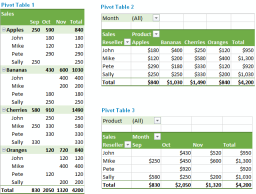 How to make and use Pivot Table in ExcelMay 13, 2025 am 09:36 AM
In this tutorial you will learn what a PivotTable is, find a number of examples showing how to create and use Pivot Tables in all version of Excel 365 through Excel 2007. If you are working with large data sets in Excel, Pivot Table comes
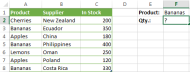
 Excel SUMIFS and SUMIF with multiple criteria – formula examplesMay 13, 2025 am 09:05 AM
This tutorial explains the difference between the SUMIF and SUMIFS functions in terms of their syntax and usage, and provides a number of formula examples to sum values with multiple AND / OR criteria in Excel 365, 2021, 2019, 2016, 2013,
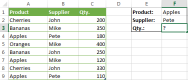
 How You Can Use Wildcards in Microsoft Excel to Refine Your SearchMay 13, 2025 am 01:59 AM
Excel wildcards: a powerful tool for efficient search and filtering This article will dive into the power of wildcards in Microsoft Excel, including their application in search, formulas, and filters, and some details to note. Wildcards allow you to perform fuzzy matching, making it more flexible to find and process data. *Wildcards: asterisks () and question marks (?)** Excel mainly uses two wildcards: asterisk (*) and question mark (?). *Asterisk (): Any number of characters** The asterisk represents any number of characters, including zero characters. For example: *OK* Match the cell containing "OK", "OK&q
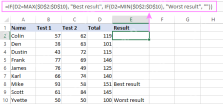 Excel IF function with multiple conditionsMay 12, 2025 am 11:02 AM
The tutorial shows how to create multiple IF statements in Excel with AND as well as OR logic. Also, you will learn how to use IF together with other Excel functions. In the first part of our Excel IF tutorial, we looked at how to constru
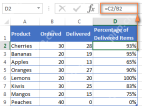 How to calculate percentage in Excel - formula examplesMay 12, 2025 am 10:28 AM
In this tutorial, you will lean a quick way to calculate percentages in Excel, find the basic percentage formula and a few more formulas for calculating percentage increase, percent of total and more. Calculating percentage is useful in m


Hot AI Tools

Undresser.AI Undress
AI-powered app for creating realistic nude photos

AI Clothes Remover
Online AI tool for removing clothes from photos.

Undress AI Tool
Undress images for free

Clothoff.io
AI clothes remover

Video Face Swap
Swap faces in any video effortlessly with our completely free AI face swap tool!

Hot Article
Hot Tools

Zend Studio 13.0.1
Powerful PHP integrated development environment

SublimeText3 Linux new version
SublimeText3 Linux latest version

SAP NetWeaver Server Adapter for Eclipse
Integrate Eclipse with SAP NetWeaver application server.

MinGW - Minimalist GNU for Windows
This project is in the process of being migrated to osdn.net/projects/mingw, you can continue to follow us there. MinGW: A native Windows port of the GNU Compiler Collection (GCC), freely distributable import libraries and header files for building native Windows applications; includes extensions to the MSVC runtime to support C99 functionality. All MinGW software can run on 64-bit Windows platforms.

DVWA
Damn Vulnerable Web App (DVWA) is a PHP/MySQL web application that is very vulnerable. Its main goals are to be an aid for security professionals to test their skills and tools in a legal environment, to help web developers better understand the process of securing web applications, and to help teachers/students teach/learn in a classroom environment Web application security. The goal of DVWA is to practice some of the most common web vulnerabilities through a simple and straightforward interface, with varying degrees of difficulty. Please note that this software

