


php editor Youzi introduced how to use error bars to create ladder diagrams in Excel. In Excel, by setting the parameters of the data series and error bars, you can easily create a chart with a trapezoidal shape, adding new visual effects to data analysis and presentation. Following the editor's guidance, you can quickly learn how to use the error bar function to create a ladder diagram in Excel, improving the expressiveness and professionalism of data charts.
1. Select data area A1:B13 and insert a scatter plot.


2. Adjust the scale of the Go to cell E1 and set the cell format to normal to get 42005. Enter the formula =E1 11*31 in cell E2 to get 42346.


3. Double-click the X-axis to bring up the settings dialog box. Fill in the two numbers obtained in the previous step in the minimum value and maximum value, and enter Add a custom format mmm to the tab and close the dialog box when finished.


4. To customize error bars, first add two sets of auxiliary columns. Make Y negative deviation in column C, make X negative deviation in column D, and enter a fixed value in C2. 0, enter the formula in C3: =B3-B2, fill down to C13, enter a fixed value -30 in D13, enter the formula in D2: =-(A3-A2), fill down to D12.

5. Select the chart and select [Error Bars] - [Standard Error Error Bars] on the [Layout] tab. At this time, you can find it in the drop-down box on the far left The X and Y error bars are out.


6. Select X error bar in the drop-down box, select [Error Bar] - [Other Error Bar Options], and select [Wireless End] in [End Style] Then select [Custom]-[Specify Value], enter 0 for the positive error value, and enter: =Sheet1 for the negative error value! $D$2:$D$13, confirmed after completion.


7. In the same way, select the Y error bar in the drop-down box, select [Error Bar]-[Other Error Bar Options], and click [End Style] 】Select [Wireless Terminal], then select [Custom]-[Specify Value], enter 0 for the positive error value, and enter 0 for the negative error value: =Sheet1! $C$2:$C$13, confirm after completion, the effect is as shown below.


8. Because the prices remain above 5, we only display the scale above 5 to expand the difference in the graph. Double-click the Y-axis, enter 5 for the minimum value, and confirm .


9. Make appropriate beautification of the chart. The final effect is as shown in the figure

Note:
Because of the nature of the date Above is a numerical value, so you can use it to make a scatter plot
The above is the detailed content of How to use error bars to create a ladder diagram in Excel. For more information, please follow other related articles on the PHP Chinese website!

 How to do a running total in Excel (Cumulative Sum formula)Apr 21, 2025 am 11:16 AM
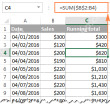
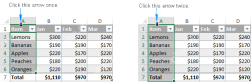
This concise guide demonstrates how to efficiently calculate running totals (cumulative sums) in Excel using a SUM formula with strategically placed absolute and relative cell references. A running total displays the accumulated sum of a dataset as
 Excel LEN function: count characters in cellApr 21, 2025 am 10:10 AM
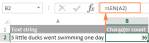
Are you looking for an Excel formula to count characters in a cell? If so, then you have certainly landed up on the right page. This short tutorial will teach you how you can use the LEN function to count characters in Excel, with or with
 How to count words in Excel - formula examplesApr 21, 2025 am 09:59 AM
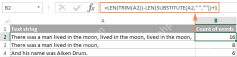
This tutorial demonstrates how to count words in Excel using a combination of the LEN, SUBSTITUTE, and TRIM functions. It offers both case-sensitive and case-insensitive formulas for counting total words or specific words/text within a cell or range
 Excel: Split string by delimiter or pattern, separate text and numbersApr 21, 2025 am 09:19 AM
This tutorial demonstrates how to efficiently split cells in Excel using both formulas and the advanced "Split Text" feature. Learn to separate text using commas, spaces, or any delimiter, and to split alphanumeric strings into their text
 Excel Solver tutorial with step-by-step examplesApr 21, 2025 am 09:15 AM
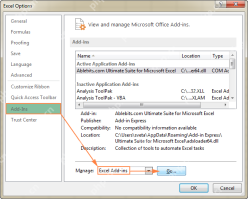
This tutorial explains how to locate and utilize the Solver add-in within various Excel versions, ranging from 2003 to 365. Step-by-step instructions and practical examples demonstrate Solver's application in optimizing solutions for linear programm
 Excel Format Painter and other ways to copy formattingApr 20, 2025 am 10:29 AM
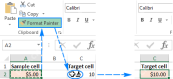
This tutorial demonstrates three efficient methods for copying formatting in Excel: Format Painter, Fill Handle, and Paste Special. These techniques are compatible with all Excel versions (2007-365). Proper formatting enhances worksheet presentation
 Clear formatting in Excel: how to remove all formats in a cellApr 20, 2025 am 10:12 AM
This tutorial offers two efficient methods for removing formatting from Excel spreadsheets. Dealing with extensive formatting in large spreadsheets can be cumbersome. These techniques streamline the process. Manually removing formatting is ineffici
 Excel table: comprehensive tutorial with examplesApr 20, 2025 am 09:48 AM
This tutorial unveils the power of Excel tables, often overlooked yet incredibly efficient tools for data management. Discover how tables simplify tasks like dynamic named ranges, formula updates, and data formatting, saving you significant time and


Hot AI Tools

Undresser.AI Undress
AI-powered app for creating realistic nude photos

AI Clothes Remover
Online AI tool for removing clothes from photos.

Undress AI Tool
Undress images for free

Clothoff.io
AI clothes remover

Video Face Swap
Swap faces in any video effortlessly with our completely free AI face swap tool!

Hot Article
Hot Tools

MantisBT
Mantis is an easy-to-deploy web-based defect tracking tool designed to aid in product defect tracking. It requires PHP, MySQL and a web server. Check out our demo and hosting services.

Dreamweaver Mac version
Visual web development tools

SublimeText3 Mac version
God-level code editing software (SublimeText3)

PhpStorm Mac version
The latest (2018.2.1) professional PHP integrated development tool

WebStorm Mac version
Useful JavaScript development tools

