


There are two ways to compress photos in Excel: compress through Excel’s built-in resize image tool or use a third-party compression tool such as TinyPNG or ImageOptim

How to compress photos in an Excel table
When processing a large number of photos in an Excel table, compressing the photo size can save storage space and improve the processing efficiency of the table. The following are two commonly used methods to compress photos:
1. Use the built-in compression tool
- Select photos:Click on the one you want to compress photos, or hold down the Ctrl key to select multiple photos.
- Right-click: Right-click on the selected photo and select "Resize".
- Select compression options: In the "Adjust Picture" dialog box, select the "Compress Picture" tab.
- Adjust settings: Select the "Target Size" and "Target Resolution" settings as needed.
- Apply changes: Click the "OK" button to apply the changes.
2. Use third-party compression tools
- Download compression tools:There are many free or paid third parties on the Internet Compression tools such as TinyPNG, ImageOptim and OptiPNG.
- Install the compression tool: Install the compression tool and set it up according to the prompts.
- Add photos: Drag and drop the photos you want to compress into the compression tool, or add them using the "Add Files" button.
- Start compression: Click the "Compress" or "Optimize" button to start the compression process.
- Save the compressed file: After the compression is completed, save the compressed photo as a new file.
No matter which method is used, you need to pay attention to the following points when compressing photos:
- Choose the appropriate compression rate: The higher the compression rate , the file size is smaller, but the image quality may be reduced.
- Preview the compression effect: Preview the compression effect before applying changes to ensure you achieve the desired quality and file size.
- Compress photos regularly: Over time, an increase in the number of photos in an Excel spreadsheet will cause the file size to increase, so compressing photos regularly can keep the spreadsheet efficient.
The above is the detailed content of How to compress excel table photos. For more information, please follow other related articles on the PHP Chinese website!

 How to use SUMIF function in Excel with formula examplesMay 13, 2025 am 10:53 AM
This tutorial explains the Excel SUMIF function in plain English. The main focus is on real-life formula examples with all kinds of criteria including text, numbers, dates, wildcards, blanks and non-blanks. Microsoft Excel has a handful o
 IF function in Excel: formula examples for text, numbers, dates, blanksMay 13, 2025 am 10:50 AM
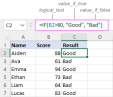
In this article, you will learn how to build an Excel IF statement for different types of values as well as how to create multiple IF statements. IF is one of the most popular and useful functions in Excel. Generally, you use an IF statem
 How to sum a column in Excel - 5 easy waysMay 13, 2025 am 09:53 AM
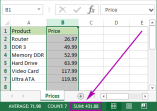
This tutorial shows how to sum a column in Excel 2010 - 2016. Try out 5 different ways to total columns: find the sum of the selected cells on the Status bar, use AutoSum in Excel to sum all or only filtered cells, employ the SUM function
 How to make and use Pivot Table in ExcelMay 13, 2025 am 09:36 AM
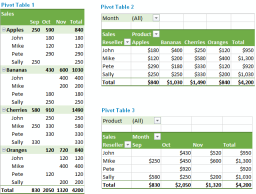
In this tutorial you will learn what a PivotTable is, find a number of examples showing how to create and use Pivot Tables in all version of Excel 365 through Excel 2007. If you are working with large data sets in Excel, Pivot Table comes
 Excel SUMIFS and SUMIF with multiple criteria – formula examplesMay 13, 2025 am 09:05 AM
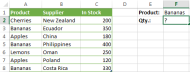
This tutorial explains the difference between the SUMIF and SUMIFS functions in terms of their syntax and usage, and provides a number of formula examples to sum values with multiple AND / OR criteria in Excel 365, 2021, 2019, 2016, 2013,
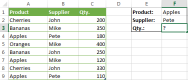
 How You Can Use Wildcards in Microsoft Excel to Refine Your SearchMay 13, 2025 am 01:59 AM
Excel wildcards: a powerful tool for efficient search and filtering This article will dive into the power of wildcards in Microsoft Excel, including their application in search, formulas, and filters, and some details to note. Wildcards allow you to perform fuzzy matching, making it more flexible to find and process data. *Wildcards: asterisks () and question marks (?)** Excel mainly uses two wildcards: asterisk (*) and question mark (?). *Asterisk (): Any number of characters** The asterisk represents any number of characters, including zero characters. For example: *OK* Match the cell containing "OK", "OK&q
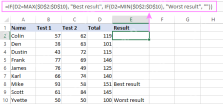 Excel IF function with multiple conditionsMay 12, 2025 am 11:02 AM
The tutorial shows how to create multiple IF statements in Excel with AND as well as OR logic. Also, you will learn how to use IF together with other Excel functions. In the first part of our Excel IF tutorial, we looked at how to constru
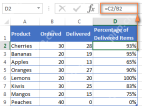 How to calculate percentage in Excel - formula examplesMay 12, 2025 am 10:28 AM
In this tutorial, you will lean a quick way to calculate percentages in Excel, find the basic percentage formula and a few more formulas for calculating percentage increase, percent of total and more. Calculating percentage is useful in m


Hot AI Tools

Undresser.AI Undress
AI-powered app for creating realistic nude photos

AI Clothes Remover
Online AI tool for removing clothes from photos.

Undress AI Tool
Undress images for free

Clothoff.io
AI clothes remover

Video Face Swap
Swap faces in any video effortlessly with our completely free AI face swap tool!

Hot Article
Hot Tools

Notepad++7.3.1
Easy-to-use and free code editor

SecLists
SecLists is the ultimate security tester's companion. It is a collection of various types of lists that are frequently used during security assessments, all in one place. SecLists helps make security testing more efficient and productive by conveniently providing all the lists a security tester might need. List types include usernames, passwords, URLs, fuzzing payloads, sensitive data patterns, web shells, and more. The tester can simply pull this repository onto a new test machine and he will have access to every type of list he needs.

MantisBT
Mantis is an easy-to-deploy web-based defect tracking tool designed to aid in product defect tracking. It requires PHP, MySQL and a web server. Check out our demo and hosting services.

ZendStudio 13.5.1 Mac
Powerful PHP integrated development environment

SublimeText3 Chinese version
Chinese version, very easy to use

