
Home >Software Tutorial >Office Software >The operation process of making the icons in the chart into a tree shape in PPT
The operation process of making the icons in the chart into a tree shape in PPT

- WBOYWBOYWBOYWBOYWBOYWBOYWBOYWBOYWBOYWBOYWBOYWBOYWBforward
- 2024-03-26 17:20:131113browse
php editor Xiaoxin brings you an article about the operation process of making the icons in the PPT chart into a tree shape. In daily work, we often need to use charts to display data in PPT, and making the icons in the chart into a tree structure can make the information clearer and more vivid. Next, let’s learn how to achieve this effect through simple steps.
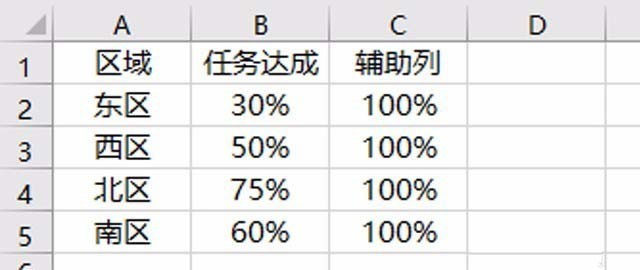
1. Data source preparation. In addition to the percentage data, the data source also requires a set of auxiliary columns, the values of which are: 100%.
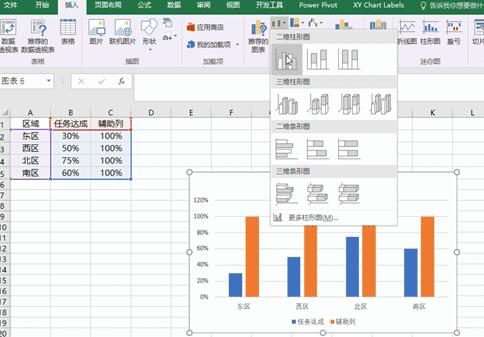
2. Insert a column chart. Select the data area and insert a clustered column chart (note: it is a clustered column chart, not a percentage stacked column chart).
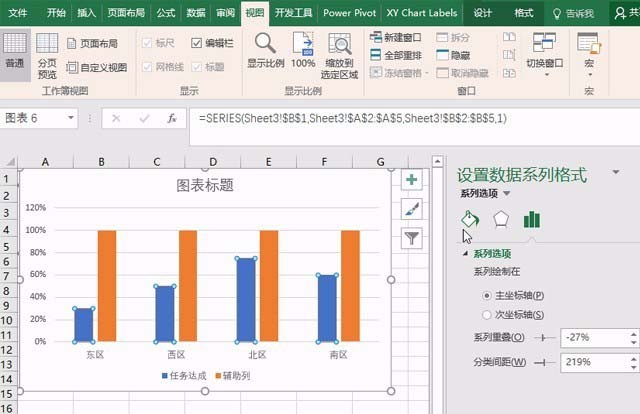
3. Replace the pillars with pictures. Click the column representing the task accomplished column on the column chart, right-click, and select Format Data Series.
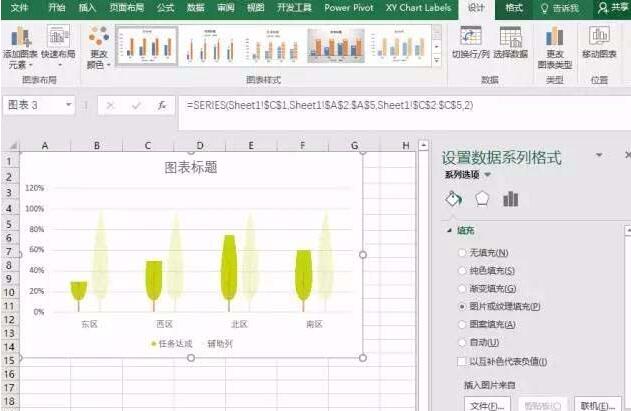
4. Replace the pillars with pictures. Select Fill and Line in Format Data Series, click Picture or Texture Fill under the Fill module, click File, insert a pre-prepared picture, and click Layer and Zoom.
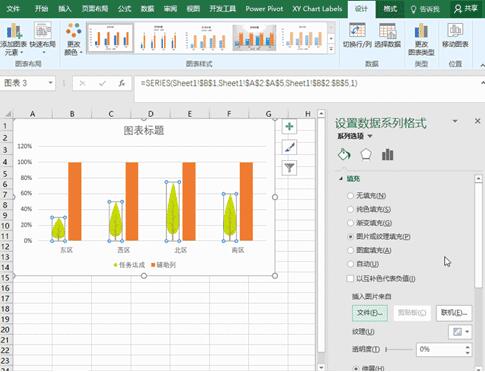
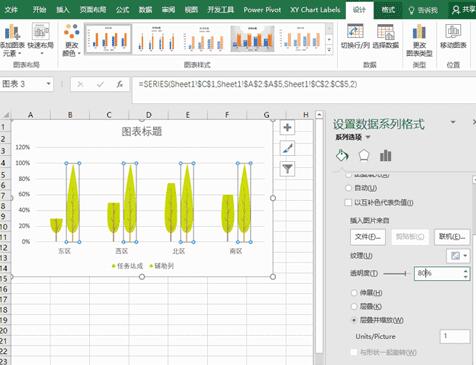
5. Replace the pillars with pictures. Use the same method to replace the pillars of the auxiliary column with images. Also select Layer and Scale, and set the transparency to 80%.
6. Merge charts. Click the series option, enter 100% in the series overlap field, and press Enter. The two charts will be merged together.
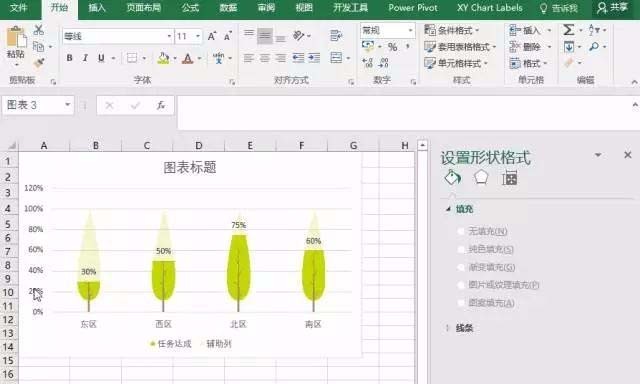
7. Add data labels, select the chart, click the Format menu, and select Series] Task Achieved in the chart area, so that the Task Achieved column is selected. Click the Design menu, click Data Label under Add Chart Element, select Data Label, and the data label is added.
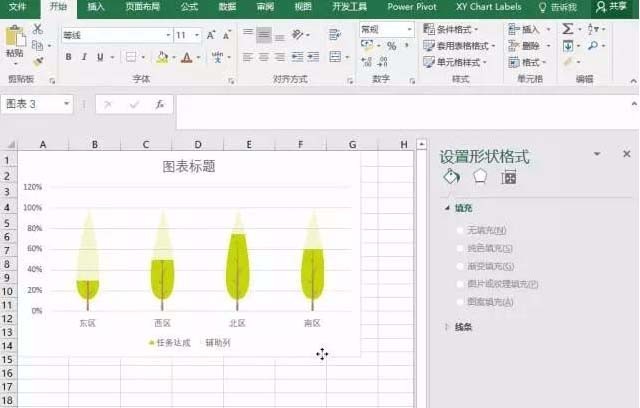
8. Adjust the chart format. Delete the Y-axis, legend, and horizontal grid lines, and set the X-axis border to no color. Change the chart title, set the font of the chart title and X-axis to Italics, and set the font of the data labels to Eras Bold IT C or another favorite font. Set the color of the chart title, X-axis, and data labels to dark gray, and finally adjust the size of the title and so on as needed.
The above is the detailed content of The operation process of making the icons in the chart into a tree shape in PPT. For more information, please follow other related articles on the PHP Chinese website!