


php editor Strawberry shares tips on how to use PPT for layout design. As a commonly used presentation tool, PPT layout design is crucial to the attractiveness and readability of the displayed content. By rationally selecting fonts, colors, layout and other elements, you can make your PPT appear more professional and attractive. This article will introduce some practical layout design skills to help readers improve the level of PPT production and make the presentation more vivid and interesting.

2. Logic charts mainly focus on the four major relationships of juxtaposition, factor, process and cycle. The specific analysis is shown in the figure.

3. Regarding the parallel relationship, it refers to an equal relationship among the factors in the chart. Each element in the chart Each element exists side by side. The specific reference case is shown in the figure.

4. About the factor chart, it mainly expresses the cause and effect between two or more things in the chart. Relationships, diagrams in cases can be flexibly applied through changes. The specific reference case is shown in the figure.

5. About the process chart, it mainly expresses the relationship between the two things in the chart, or the same Progressive relationships between different aspects of things. Please refer to the figure for specific cases.

6. Regarding the circular relationship, it refers to the link between things in the chart, and it is also a parallel relationship. The specific reference case is shown in the figure.

7. For example, the relationship presented by each paragraph of text in the case is a parallel relationship. Please refer to the figure for details. Show.

8. According to the parallel relationship of the text, use the parallel arrangement to arrange the text horizontally. Specific reference is shown in the figure.

9. Depending on the length of the text, you can use the cyclic relationship in the parallel relationship to arrange the text. Make the layout more unified. Specific reference is shown in the figure.

10. Based on the text content, extract paragraph keywords as titles, and add decorative icons to beautify the layout. Specific reference is shown in the figure.

11. When receiving a row of copywriting, analyze the content of the copywriting and the length of the text before production. Choose appropriate logical relationships to arrange the copy. Specific reference is shown in the figure.

12. Regarding the logic chart plug-in [Beautification Master], [Open] the PPT software, click [Beautification Master] , click [New]-[Slide], select [Image], and select the corresponding logical relationship as needed. The specific operation is as shown in the figure.

13. Another plug-in is Islide, click [islide], click [Resources]-[Image] Library], select the appropriate chart as needed, and click [Insert]. The specific operation is as shown in the figure.

14. Another way is to search for the corresponding logical relationship chart through the material network. [Select] AI format, [Import] the AI document to PPT for application. The specific operation is as shown in the figure.

The above is the detailed content of How to use PPT for layout design. For more information, please follow other related articles on the PHP Chinese website!

 How to convert number to text in Excel - 4 quick waysMay 15, 2025 am 10:10 AM
This tutorial shows how to convert numbers to text in Excel 2016, 2013, and 2010. Learn how to do this using Excel's TEXT function and use numbers to strings to specify the format. Learn how to change the format of numbers to text using the Format Cell… and Text to Column options. If you use an Excel spreadsheet to store long or short numbers, you may want to convert them to text one day. There may be different reasons to change the number stored as a number to text. Here is why you might need to have Excel treat the entered number as text instead of numbers: Search by part rather than the whole number. For example, you might want to find all numbers containing 50, such as 501
 How to make a dependent (cascading) drop-down list in ExcelMay 15, 2025 am 09:48 AM
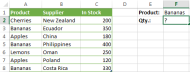
We recently delved into the basics of Excel Data Validation, exploring how to set up a straightforward drop-down list using a comma-separated list, cell range, or named range.In today's session, we'll delve deeper into this functionality, focusing on
 How to create drop down list in Excel: dynamic, editable, searchableMay 15, 2025 am 09:47 AM
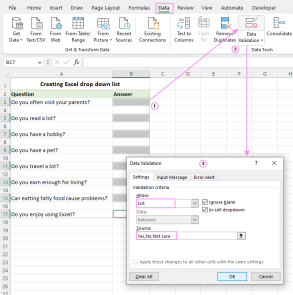
This tutorial shows simple steps to create a drop-down list in Excel: Create from cell ranges, named ranges, Excel tables, other worksheets. You will also learn how to make Excel drop-down menus dynamic, editable, and searchable. Microsoft Excel is good at organizing and analyzing complex data. One of its most useful features is the ability to create drop-down menus that allow users to select items from predefined lists. The drop-down menu allows for faster, more accurate and more consistent data entry. This article will show you several different ways to create drop-down menus in Excel. - Excel drop-down list - How to create dropdown list in Excel - From the scope - From the naming range
 Convert PDF to Excel manually or using online convertersMay 15, 2025 am 09:40 AM
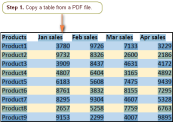
The PDF format, known for its ability to display documents independently of the user's software, hardware, or operating system, has become the standard for electronic file sharing.When requesting information, it's common to receive a well-formatted P
 How to convert Excel files to PDFMay 15, 2025 am 09:37 AM
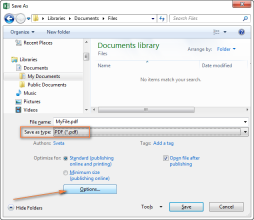
This short tutorial describes 4 possible ways to convert Excel files to PDF - using Excel's Save As feature, Adobe software, online Excel to PDF converter, and desktop tools. Converting an Excel worksheet to a PDF is usually necessary if you want other users to be able to view your data but can't edit it. You may also want to convert Excel spreadsheets to PDF format for use in media toolkits, presentations, and reports, or create a file that all users can open and read even if they don't have Microsoft Excel installed, such as on a tablet or phone. Today, PDF is undoubtedly one of the most popular file formats. According to Google
 How to use SUMIF function in Excel with formula examplesMay 13, 2025 am 10:53 AM
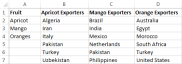
This tutorial explains the Excel SUMIF function in plain English. The main focus is on real-life formula examples with all kinds of criteria including text, numbers, dates, wildcards, blanks and non-blanks. Microsoft Excel has a handful o
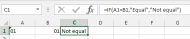
 IF function in Excel: formula examples for text, numbers, dates, blanksMay 13, 2025 am 10:50 AM
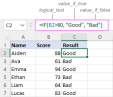
In this article, you will learn how to build an Excel IF statement for different types of values as well as how to create multiple IF statements. IF is one of the most popular and useful functions in Excel. Generally, you use an IF statem
 How to sum a column in Excel - 5 easy waysMay 13, 2025 am 09:53 AM
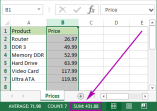
This tutorial shows how to sum a column in Excel 2010 - 2016. Try out 5 different ways to total columns: find the sum of the selected cells on the Status bar, use AutoSum in Excel to sum all or only filtered cells, employ the SUM function


Hot AI Tools

Undresser.AI Undress
AI-powered app for creating realistic nude photos

AI Clothes Remover
Online AI tool for removing clothes from photos.

Undress AI Tool
Undress images for free

Clothoff.io
AI clothes remover

Video Face Swap
Swap faces in any video effortlessly with our completely free AI face swap tool!

Hot Article
Hot Tools

Dreamweaver Mac version
Visual web development tools

SublimeText3 Mac version
God-level code editing software (SublimeText3)

WebStorm Mac version
Useful JavaScript development tools

Atom editor mac version download
The most popular open source editor

DVWA
Damn Vulnerable Web App (DVWA) is a PHP/MySQL web application that is very vulnerable. Its main goals are to be an aid for security professionals to test their skills and tools in a legal environment, to help web developers better understand the process of securing web applications, and to help teachers/students teach/learn in a classroom environment Web application security. The goal of DVWA is to practice some of the most common web vulnerabilities through a simple and straightforward interface, with varying degrees of difficulty. Please note that this software

