
 Software TutorialOffice SoftwareHow to make WPS table line chart, do you really know how to do it?
How to make WPS table line chart, do you really know how to do it?

php editor Banana will give you a detailed analysis of how to create a line chart in a WPS table. A line chart is a type of chart that visually displays data trends, and it is not complicated to create in a WPS table. With simple operations, you can easily create beautiful and informative line charts to make your data more vivid and intuitive. Next, let us learn how to make a WPS table line chart!
1. First check [Usage Scenarios of Line Chart].

2. Production method: First select [Data Source-Insert Chart-Line Chart] and click [Chart Elements-Check Trend Line-a dotted line will appear in the chart accordingly. 】.

3. Then insert a column of average in the [data source] and use [AVERAGE to calculate the average] drop-down filling method [copy and paste the value first-then in the drop-down filling】.

4. Then add the method: [①: Select the chart, in the chart tool - edit data source - click ' ' to select the data source in the series value] [②: Select the chart, and the data source will appear in the chart area - then drag the arrow to select the column corresponding to the average value].

5. Select [Polyline] and then [right-click-Format Cells-Data Series Options-Fill and Line] and then beautify the chart.

# 6. The beautification effect of other lines is the same, adjust it according to your favorite style.

7. Then adjust the [position of the legend, elongate the chart] and add a title to the chart element - at the top.

8. Then go to [Adjust horizontal axis date] and select [right-click to set axis format] to adjust the date display category. [Modify the tilt under the size and properties panel. 】.

The above is the detailed content of How to make WPS table line chart, do you really know how to do it?. For more information, please follow other related articles on the PHP Chinese website!

 How to add and subtract dates in ExcelMay 08, 2025 am 11:36 AM
In this tutorial, you will find a variety of useful formulas to add and subtract dates in Excel, such as subtracting two dates, adding days, weeks, months and years to a date, and more. If you have been following our tutorials to working
 Excel WORKDAY and NETWORKDAYS functions to calculate working daysMay 08, 2025 am 10:49 AM
This tutorial demonstrates how to use Excel's WORKDAY, WORKDAY.INTL, NETWORKDAYS, and NETWORKDAYS.INTL functions to efficiently calculate weekdays, considering custom weekend settings and holidays. Microsoft Excel offers specialized functions for wor
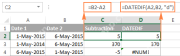
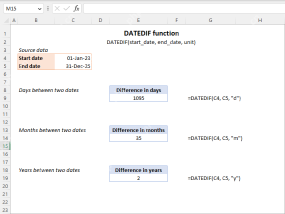 Excel DATEDIF function to get difference between two datesMay 08, 2025 am 10:45 AM
This tutorial provides a concise explanation of Excel's DATEDIF function and offers formula examples for calculating date differences in days, weeks, months, or years. We've previously covered date and time manipulation in Excel, including formattin
 Excel YEAR function - convert date to yearMay 08, 2025 am 09:19 AM
This tutorial explains the syntax and uses of the Excel YEAR function and provides formula examples to extract year from date, convert date to month and year, calculate age from the date of birth and determine leap years. In a few recent
 Time formatting in Excel: 12/24 hour, custom, defaultMay 07, 2025 am 10:42 AM
This tutorial explains the basics and beyond of the Excel time format. Microsoft Excel has a handful of time features and knowing them in depth can save you a lot of time. To leverage powerful time functions, it helps to know how Excel st
 Excel date functions - formula examples of DATE, TODAY, etc.May 07, 2025 am 09:03 AM
This is the final part of our Excel Date Tutorial that offers an overview of all Excel date functions, explains their basic uses and provides lots of formula examples. Microsoft Excel provides a ton of functions to work with dates and ti
 RAND and RANDBETWEEN functions to generate random numbers in ExcelMay 07, 2025 am 09:02 AM
The tutorial explains the specificities of the Excel random number generator algorithm and demonstrates how to use RAND and RANDBETWEEN functions to generate random numbers, dates, passwords and other text strings in Excel. Before we delv
 5 Excel Tips for Power UsersMay 07, 2025 am 12:55 AM
Excel efficiency improvement: Five practical tips to help you process tables quickly Even users who have been using Microsoft Excel for decades can always discover new techniques to improve efficiency. This article shares five practical Excel tips I have accumulated over the years to help you speed up your spreadsheet workflow. 1. No need to freeze the first line: Use Excel tables cleverly When working with Excel tables containing a lot of data, you may get used to freezing the first row through the View tab so that the header is always visible when scrolling. But in fact, if you format the data as an Excel table, you don't need this step. First, make sure that the first row of the data contains the column title. Then, select the data and click "Table" in the "Insert" tab. 2.


Hot AI Tools

Undresser.AI Undress
AI-powered app for creating realistic nude photos

AI Clothes Remover
Online AI tool for removing clothes from photos.

Undress AI Tool
Undress images for free

Clothoff.io
AI clothes remover

Video Face Swap
Swap faces in any video effortlessly with our completely free AI face swap tool!

Hot Article
Hot Tools

SublimeText3 Mac version
God-level code editing software (SublimeText3)

VSCode Windows 64-bit Download
A free and powerful IDE editor launched by Microsoft

SublimeText3 English version
Recommended: Win version, supports code prompts!

SublimeText3 Linux new version
SublimeText3 Linux latest version

Dreamweaver CS6
Visual web development tools

