


If you want to insert a histogram into a WPS document, you can easily complete it in just a few simple steps. First, select the data to be inserted into the histogram in the document, then click the "Insert" option in the menu bar, select "Chart" and select the "Histogram" type in the pop-up window, and finally adjust the chart style and data source according to your needs , you can generate the histogram you want. Hope the above content is helpful to you!
After we open the WPS software we are using, the interface will differ depending on the WPS version, but it will not affect the operation. Next, find the "Insert" option in the main menu bar. After opening it, you will see the chart option.

After the chart is opened, the first one is the so-called column chart. In fact, there are three types of column charts, namely clustered column chart and stacked column chart. Bar chart and percentage stacked column chart, we can choose which one we need. Let me first introduce the use of this clustered column chart.


After selecting the clustered column chart, we can click OK below key, so that the column chart will appear in the operation interface, as shown in the figure.

We can see that the clustered column chart is actually divided into 4 styles. We can choose which one is best and best matches our work.
Then we can modify the color of the column according to our own requirements. We can choose the best color for ourselves. The method is to double-click the column in the graph, and the column attributes will appear, and we can modify it. .


We can also click the left mouse button to display the options on the right and select the chart filter to modify the category and name of the chart. Title, value, etc., as shown in the figure.


So about how to make a WPS histogram, the editor has introduced it here. I hope your friends can watch it carefully and remember how to operate the column. When you really need it, I hope you can remember what the editor talked about today as soon as possible.
The above is the detailed content of How to make a histogram in WPS documents. For more information, please follow other related articles on the PHP Chinese website!

 How to create formulas in ExcelApr 26, 2025 am 09:47 AM
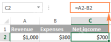
This tutorial guides you through creating Excel formulas, starting with the basics. You'll learn to build formulas using constants, cell references, defined names, and functions. We'll also explore using the Function Wizard and direct formula entry.
 Circular reference in Excel: how to find, enable, use, or removeApr 26, 2025 am 09:30 AM
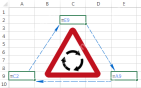
This concise guide explains Excel circular references, their pitfalls, and how to manage them. Learn to identify, locate, and eliminate circular references, or, if necessary, how to enable and utilize circular formulas. Encountering a "circula
 Excel 3D reference: refer to the same cell or range in multiple worksheetsApr 26, 2025 am 09:16 AM
This tutorial explains Excel's powerful 3D referencing feature, enabling efficient data manipulation across multiple worksheets. Learn how to reference identical cells or ranges across selected sheets, and build formulas for aggregating data from va
 How to show formulas in ExcelApr 26, 2025 am 09:12 AM
This tutorial shows you how to easily display formulas in Excel (versions 2016, 2013, 2010, and older). Learn how to print formulas and troubleshoot why Excel sometimes displays a formula instead of the result. Working with spreadsheets containing n
 How to lock and hide formulas in ExcelApr 25, 2025 am 10:52 AM
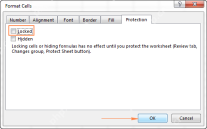
This tutorial explains how to conceal Excel formulas from the formula bar and protect them from unauthorized changes. Learn to lock individual or all formulas, ensuring data confidentiality and integrity. Microsoft Excel simplifies formula interpret
 How to copy formula in Excel with or without changing referencesApr 25, 2025 am 10:17 AM
This Excel tutorial explores various methods for copying formulas, addressing specific scenarios beyond simple mouse clicks. We'll cover copying formulas down columns, across entire columns, to non-adjacent cells, and techniques for preserving forma
 How to edit, evaluate and debug formulas in ExcelApr 25, 2025 am 09:52 AM
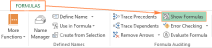
In this tutorial, you will learn a few quick and efficient ways to check and debug formulas in Excel. See how to use the F9 key to evaluate formula parts, how to highlight cells that reference or are referenced by a given formula, how to
 Excel formulas not working: how to fix formulas not updating or not calculatingApr 25, 2025 am 09:24 AM
This tutorial tackles common Excel formula errors, helping you troubleshoot formulas that won't calculate or update. Who can imagine Excel without formulas? Yet, malfunctioning formulas are incredibly frustrating. This guide provides solutions to


Hot AI Tools

Undresser.AI Undress
AI-powered app for creating realistic nude photos

AI Clothes Remover
Online AI tool for removing clothes from photos.

Undress AI Tool
Undress images for free

Clothoff.io
AI clothes remover

Video Face Swap
Swap faces in any video effortlessly with our completely free AI face swap tool!

Hot Article
Hot Tools

WebStorm Mac version
Useful JavaScript development tools

mPDF
mPDF is a PHP library that can generate PDF files from UTF-8 encoded HTML. The original author, Ian Back, wrote mPDF to output PDF files "on the fly" from his website and handle different languages. It is slower than original scripts like HTML2FPDF and produces larger files when using Unicode fonts, but supports CSS styles etc. and has a lot of enhancements. Supports almost all languages, including RTL (Arabic and Hebrew) and CJK (Chinese, Japanese and Korean). Supports nested block-level elements (such as P, DIV),

EditPlus Chinese cracked version
Small size, syntax highlighting, does not support code prompt function

DVWA
Damn Vulnerable Web App (DVWA) is a PHP/MySQL web application that is very vulnerable. Its main goals are to be an aid for security professionals to test their skills and tools in a legal environment, to help web developers better understand the process of securing web applications, and to help teachers/students teach/learn in a classroom environment Web application security. The goal of DVWA is to practice some of the most common web vulnerabilities through a simple and straightforward interface, with varying degrees of difficulty. Please note that this software

SublimeText3 English version
Recommended: Win version, supports code prompts!

