Home >Software Tutorial >Computer Software >How to use excel to make a line chart - How to use excel to make a line chart
How to use excel to make a line chart - How to use excel to make a line chart
- WBOYWBOYWBOYWBOYWBOYWBOYWBOYWBOYWBOYWBOYWBOYWBOYWBforward
- 2024-03-04 13:25:041693browse
php editor Apple introduces you how to use Excel to create a line chart. A line chart is a type of chart that visually displays data trends. It is suitable for showing changes in data over time, sequence, or categories. Making a line chart in Excel is very easy, just follow the steps below.
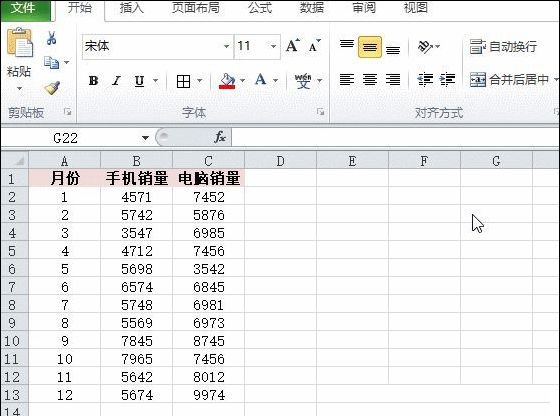
1. Open the Excel data table (as shown in the figure below).

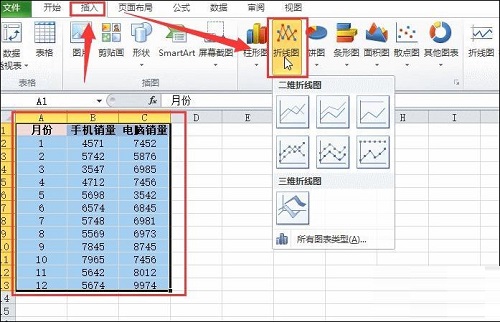
2. Select all the table contents, and then click Insert - Line Chart in the menu bar (as shown in the figure below).

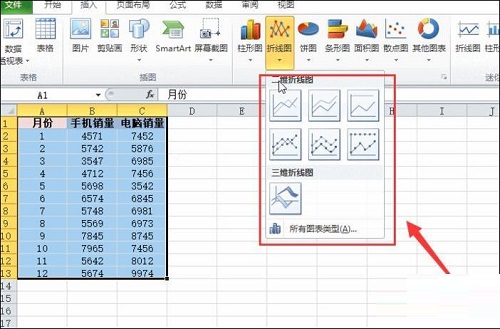
3. Select a line chart you like and click on it (as shown in the picture below).

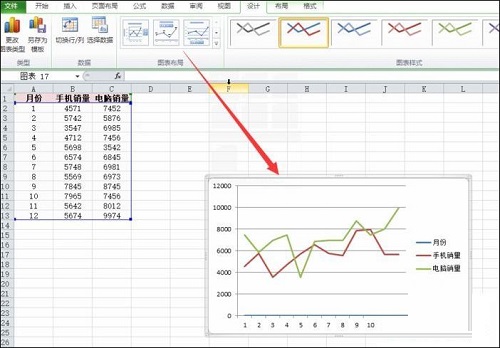
4. Finally, a line chart with consistent data will be automatically generated in the Excel table (as shown in the figure below).

The above is the entire content of how to use Excel to make a line chart brought to you by the editor. I hope it can be helpful to you.
The above is the detailed content of How to use excel to make a line chart - How to use excel to make a line chart. For more information, please follow other related articles on the PHP Chinese website!

