

My favorite Linux top command options

When I check a Linux system (or even troubleshoot a computer running another operating system), I often use the top command to check the system's RAM and CPU usage. It provides me with information to assess the overall health of my computer. I learned about the top command early in my Linux journey and relied on it to give me a quick overview of what was going on on a server or other Linux system, including a Raspberry Pi. But there's more to the top command than meets the eye. According to its man page, the top program provides a dynamic, real-time view of a running system. It displays system summary information and a list of processes or threads currently managed by the Linux kernel.
However, there is more to the top command than meets the eye. The specific functionality of your top command may vary depending on the version you are running (procps-ng, Busybox, BSD), so see the man page for details.
To start top, enter in the terminal:
linuxmi@linuxmi:~/www.linuxmi.com$ top
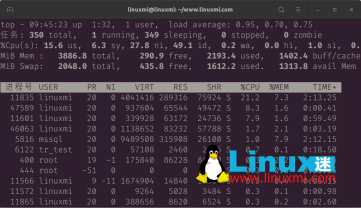
Running processes are displayed below the table title on the top screen, and system statistics are displayed above it.
top - 09:46:05 up  1:33,  1 user,  load average: 0.76, 0.67, 0.74
任务: 350 total,   1 running, 349 sleeping,   0 stopped,   0 zombie
%Cpu(s):  1.0 us,  0.7 sy,  0.0 ni, 97.8 id,  0.0 wa,  0.0 hi,  0.5 si,  0.
MiB Mem :   3886.8 total,    307.9 free,   2175.1 used,   1403.8 buff/cache
MiB Swap:   2048.0 total,    435.8 free,   1612.2 used.   1332.7 avail Mem

 进程号 USER      PR  NI    VIRT    RES    SHR    %CPU  %MEM     TIME+
   5816 mssql     20   0 9489420 315860  26100 S   2.3   7.9   2:12.97
     99 root       0 -20       0      0      0 I   0.7   0.0   0:09.20
   1141 root      20   0  242936   6504   5452 S   0.7   0.2   0:37.47
  11835 linuxmi   20   0 4041480 290588  75920 S   0.7   7.3   2:16.77
   1924 root      20   0   66412   4732   4156 S   0.3   0.1   0:14.17
   2815 vcache    20   0  278864  87112  85116 S   0.3   2.2   0:03.56
   3371 linuxmi+  20   0  190672   5148   3132 S   0.3   0.1   0:04.49
   3598 linuxmi+  20   0   57108   2404   2032 S   0.3   0.1   0:16.62
   5864 tr_test   20   0  190672   5780   3080 S   0.3   0.1   0:04.62
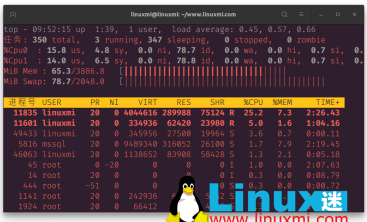
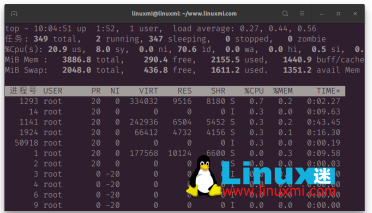
Press the Z key to change the color of the output. I find this makes the output easier on the eye.

Press the 1 key to view a graphical representation of each CPU core on the system. Press 1 repeatedly to evaluate the kernel statistics of the CPU core.
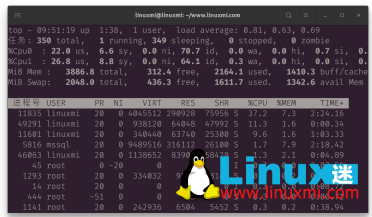
You can graphically display memory usage by calling the top command and then pressing the m key.
Useful top options
If you are only looking for processes started by a specific user, you can use the following -u option to get that information:
linuxmi@linuxmi:~/www.linuxmi.com$ top -u 'root'
To obtain a list of idle processes on the system, use the following -i option:
linuxmi@linuxmi:~/www.linuxmi.com$ top -i
You can set the update interval to any value in seconds. The default value is 3 seconds. Change it to 5 like this:
linuxmi@linuxmi:~/www.linuxmi.com$ top -d 5

You can also run top on a timer. For example, the following command sets the number of iterations to two and then exits:
linuxmi@linuxmi:~/www.linuxmi.com$ top -n 2
Use top to locate a process
Press Shift L to find processes by name. This creates a hint above the bold table title row. Enter the name of the process you want to find and press Enter or Return to see instances of that process highlighted in the newly sorted list of processes.

Use top to stop the process
You can also use top to stop or "kill" a running process. First, find the process you want to stop using Shift L or pgrep. Next, press K and enter the ID of the process you want to stop. The default value is whatever is at the top of the list, so make sure you enter the PID you want to stop before pressing Enter, otherwise you might stop a process you didn't intend to stop.
top iteration
This command has many iterations top, including htop, atop, btop and ttop. There are also specialized top commands, such as the Linux power saving tool powertop and the network traffic monitoring tool ntop.
The above is the detailed content of My favorite Linux top command options. For more information, please follow other related articles on the PHP Chinese website!

 What are the main tasks of a Linux system administrator?Apr 19, 2025 am 12:23 AM
The main tasks of Linux system administrators include system monitoring and performance tuning, user management, software package management, security management and backup, troubleshooting and resolution, performance optimization and best practices. 1. Use top, htop and other tools to monitor system performance and tune it. 2. Manage user accounts and permissions through useradd commands and other commands. 3. Use apt and yum to manage software packages to ensure system updates and security. 4. Configure a firewall, monitor logs, and perform data backup to ensure system security. 5. Troubleshoot and resolve through log analysis and tool use. 6. Optimize kernel parameters and application configuration, and follow best practices to improve system performance and stability.
 Is it hard to learn Linux?Apr 18, 2025 am 12:23 AM
Learning Linux is not difficult. 1.Linux is an open source operating system based on Unix and is widely used in servers, embedded systems and personal computers. 2. Understanding file system and permission management is the key. The file system is hierarchical, and permissions include reading, writing and execution. 3. Package management systems such as apt and dnf make software management convenient. 4. Process management is implemented through ps and top commands. 5. Start learning from basic commands such as mkdir, cd, touch and nano, and then try advanced usage such as shell scripts and text processing. 6. Common errors such as permission problems can be solved through sudo and chmod. 7. Performance optimization suggestions include using htop to monitor resources, cleaning unnecessary files, and using sy
 What is the salary of Linux administrator?Apr 17, 2025 am 12:24 AM
The average annual salary of Linux administrators is $75,000 to $95,000 in the United States and €40,000 to €60,000 in Europe. To increase salary, you can: 1. Continuously learn new technologies, such as cloud computing and container technology; 2. Accumulate project experience and establish Portfolio; 3. Establish a professional network and expand your network.
 What is the main purpose of Linux?Apr 16, 2025 am 12:19 AM
The main uses of Linux include: 1. Server operating system, 2. Embedded system, 3. Desktop operating system, 4. Development and testing environment. Linux excels in these areas, providing stability, security and efficient development tools.
 Does the internet run on Linux?Apr 14, 2025 am 12:03 AM
The Internet does not rely on a single operating system, but Linux plays an important role in it. Linux is widely used in servers and network devices and is popular for its stability, security and scalability.
 What are Linux operations?Apr 13, 2025 am 12:20 AM
The core of the Linux operating system is its command line interface, which can perform various operations through the command line. 1. File and directory operations use ls, cd, mkdir, rm and other commands to manage files and directories. 2. User and permission management ensures system security and resource allocation through useradd, passwd, chmod and other commands. 3. Process management uses ps, kill and other commands to monitor and control system processes. 4. Network operations include ping, ifconfig, ssh and other commands to configure and manage network connections. 5. System monitoring and maintenance use commands such as top, df, du to understand the system's operating status and resource usage.
 Boost Productivity with Custom Command Shortcuts Using Linux AliasesApr 12, 2025 am 11:43 AM
Introduction Linux is a powerful operating system favored by developers, system administrators, and power users due to its flexibility and efficiency. However, frequently using long and complex commands can be tedious and er
 What is Linux actually good for?Apr 12, 2025 am 12:20 AM
Linux is suitable for servers, development environments, and embedded systems. 1. As a server operating system, Linux is stable and efficient, and is often used to deploy high-concurrency applications. 2. As a development environment, Linux provides efficient command line tools and package management systems to improve development efficiency. 3. In embedded systems, Linux is lightweight and customizable, suitable for environments with limited resources.


Hot AI Tools

Undresser.AI Undress
AI-powered app for creating realistic nude photos

AI Clothes Remover
Online AI tool for removing clothes from photos.

Undress AI Tool
Undress images for free

Clothoff.io
AI clothes remover

Video Face Swap
Swap faces in any video effortlessly with our completely free AI face swap tool!

Hot Article
Hot Tools

MantisBT
Mantis is an easy-to-deploy web-based defect tracking tool designed to aid in product defect tracking. It requires PHP, MySQL and a web server. Check out our demo and hosting services.

SAP NetWeaver Server Adapter for Eclipse
Integrate Eclipse with SAP NetWeaver application server.

MinGW - Minimalist GNU for Windows
This project is in the process of being migrated to osdn.net/projects/mingw, you can continue to follow us there. MinGW: A native Windows port of the GNU Compiler Collection (GCC), freely distributable import libraries and header files for building native Windows applications; includes extensions to the MSVC runtime to support C99 functionality. All MinGW software can run on 64-bit Windows platforms.

PhpStorm Mac version
The latest (2018.2.1) professional PHP integrated development tool

Atom editor mac version download
The most popular open source editor

