


MedCalc is a medical-specific statistical calculation software that is widely used in the field of medical research. The software is not large, but its functions are very powerful. It uses a graphical interface to intuitively and clearly display the statistical results. The main feature of the software is that it can analyze the ROC curve, providing the necessary tools and equipment for analyzing the system characteristic curve ROC, drawing data and performing statistical calculations. But how does medcalc do roc curve? Today I will briefly share with you the medcalc roc curve tutorial.
How to make ROC curve with Medcalc
1. First, open the software.
2. Enter the data to be analyzed. The first column is named g, which represents grouping; the second column is named x, which represents data. Groups are represented by 0 and 1.

3. Click "Statistics"-"ROC curve"-"ROC curve analysis..." to pop up the interface.

4. Select the group corresponding to the variable and click "OK".

5. The first interface that pops up is the ROC curve. The abscissa represents 1-specificity, and the ordinate represents sensitivity.

6. The second interface is specific parameter information, mainly including the area under the curve (AUC) and the percentage of sensitivity and specificity.

The above is the detailed content of Learn how to plot an ROC curve in medcalc. For more information, please follow other related articles on the PHP Chinese website!

 Instagram Just Launched Its Version of CapCutApr 30, 2025 am 10:25 AM
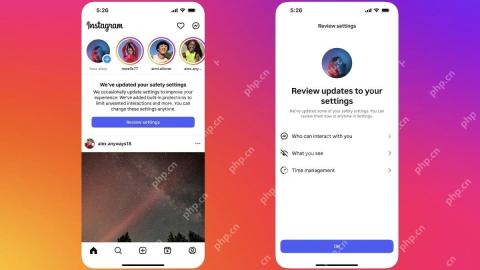
Instagram officially launched the Edits video editing app to seize the mobile video editing market. The release has been three months since Instagram first announced the app, and two months after the original release date of Edits in February. Instagram challenges TikTok Instagram’s self-built video editor is of great significance. Instagram is no longer just an app to view photos and videos posted by individuals and companies: Instagram Reels is now its core feature. Short videos are popular all over the world (even LinkedIn has launched short video features), and Instagram is no exception
 Chess Lessons Are Coming to DuolingoApr 24, 2025 am 10:41 AM
Duolingo, renowned for its language-learning platform, is expanding its offerings! Later this month, iOS users will gain access to new chess lessons integrated seamlessly into the familiar Duolingo interface. The lessons, designed for beginners, wi
 Blue Check Verification Is Coming to BlueskyApr 24, 2025 am 10:17 AM
Bluesky Echoes Twitter's Past: Introducing Official Verification Bluesky, the decentralized social media platform, is mirroring Twitter's past by introducing an official verification process. This will supplement the existing self-verification optio
 Google Photos Now Lets You Convert Standard Photos to Ultra HDRApr 24, 2025 am 10:15 AM
Ultra HDR: Google Photos' New Image Enhancement Ultra HDR is a cutting-edge image format offering superior visual quality. Like standard HDR, it packs more data, resulting in brighter highlights, deeper shadows, and richer colors. The key differenc
 You Should Try Instagram's New 'Blend' Feature for a Custom Reels FeedApr 23, 2025 am 11:35 AM
Instagram and Spotify now offer personalized "Blend" features to enhance social sharing. Instagram's Blend, accessible only through the mobile app, creates custom daily Reels feeds for individual or group chats. Spotify's Blend mirrors th
 Instagram Is Using AI to Automatically Enroll Minors Into 'Teen Accounts'Apr 23, 2025 am 10:00 AM
Meta is cracking down on underage Instagram users. Following the introduction of "Teen Accounts" last year, featuring restrictions for users under 18, Meta has expanded these restrictions to Facebook and Messenger, and is now enhancing its
 Should I Use an Agent for Taobao?Apr 22, 2025 pm 12:04 PM
Navigating Taobao: Why a Taobao Agent Like BuckyDrop Is Essential for Global Shoppers The popularity of Taobao, a massive Chinese e-commerce platform, presents a challenge for non-Chinese speakers or those outside China. Language barriers, payment c
 How Can I Avoid Buying Fake Products On Taobao?Apr 22, 2025 pm 12:03 PM
Navigating the vast marketplace of Taobao requires vigilance against counterfeit goods. This article provides practical tips to help you identify and avoid fake products, ensuring a safe and satisfying shopping experience. Scrutinize Seller Feedbac


Hot AI Tools

Undresser.AI Undress
AI-powered app for creating realistic nude photos

AI Clothes Remover
Online AI tool for removing clothes from photos.

Undress AI Tool
Undress images for free

Clothoff.io
AI clothes remover

Video Face Swap
Swap faces in any video effortlessly with our completely free AI face swap tool!

Hot Article
Hot Tools

WebStorm Mac version
Useful JavaScript development tools

SecLists
SecLists is the ultimate security tester's companion. It is a collection of various types of lists that are frequently used during security assessments, all in one place. SecLists helps make security testing more efficient and productive by conveniently providing all the lists a security tester might need. List types include usernames, passwords, URLs, fuzzing payloads, sensitive data patterns, web shells, and more. The tester can simply pull this repository onto a new test machine and he will have access to every type of list he needs.

DVWA
Damn Vulnerable Web App (DVWA) is a PHP/MySQL web application that is very vulnerable. Its main goals are to be an aid for security professionals to test their skills and tools in a legal environment, to help web developers better understand the process of securing web applications, and to help teachers/students teach/learn in a classroom environment Web application security. The goal of DVWA is to practice some of the most common web vulnerabilities through a simple and straightforward interface, with varying degrees of difficulty. Please note that this software

EditPlus Chinese cracked version
Small size, syntax highlighting, does not support code prompt function

MinGW - Minimalist GNU for Windows
This project is in the process of being migrated to osdn.net/projects/mingw, you can continue to follow us there. MinGW: A native Windows port of the GNU Compiler Collection (GCC), freely distributable import libraries and header files for building native Windows applications; includes extensions to the MSVC runtime to support C99 functionality. All MinGW software can run on 64-bit Windows platforms.

