
 Software TutorialOffice SoftwarePowerDesigner User Guide: Draw use case diagrams, sequence diagrams, collaboration diagrams, state diagrams and activity diagrams
How to draw use case diagram sequence diagram collaboration diagram state diagram activity diagram in PowerDesigner
Create a use case diagram, open PD, and do the following:
To solve this puzzle we need to follow the steps below. First, open the software and select the "File" option, and find the "New Model" option in the drop-down menu. Next, select "Categories" and then "Business." In the business model, select "Use Case Definition". Now, you will see an interface with a small man symbol and a use case symbol on the panel. By dragging and connecting these symbols, you can manipulate the relationships between use cases. If you want to adjust the line style, click "Show Preferences" in the toolbar and select "Format". In the formatting options, find "Use Case Association" and select the last S-shaped line style so you can turn the curve into a straight line.
We can create models of activities, components and sequences by using UML activity diagrams, component diagrams and sequence diagrams. In the category, select the application and draw using the Model panel. Use UML activity diagrams to describe the activity flow of the system, use UML component diagrams to represent the component structure of the system, and use UML sequence diagrams to show the interaction sequence between various objects in the system. Through these graphics, we can understand the structure and behavior of the system more clearly.
In order to create a database model, you first need to make an ER diagram. We can follow these steps: 1. Create two entities: Categories and Information. Classification entities contain attributes such as name and description, while information entities can contain relevant details. 2. In the ER diagram, use appropriate symbols and arrows to represent the relationships between entities. For example, you can use a solid arrow to represent the relationship between a Classification entity and an Information entity. 3. Click on the first legend to create Conceptual Data. This will help us convert entities and relationships into a visual representation of the database model. Through the above steps, we can create a simple but effective database model to better organize and manage classification and information data
Note: To understand the meaning of CDM/PDM/OOM/BPM respectively, they can be converted into each other.
CDM: Conceptual Data Model
PDM: Physical Data Model
OOM: Object-oriented model
BPM: Enterprise Process Model
If you want to do software development, please use OOM more.
Of course, CDM/PDM can also be used, and different models can be generated through the menu "Tools".
How to draw use case diagram in visio2007
Steps to draw UML use case diagram in Visio:
1. On the File menu, point to New, then Software, and then click UML Model Diagram.
2. In the tree view, right-click the package or subsystem to contain the use case diagram, point to "New", and then click "Use Case Diagram".
A blank page will appear, and the "UML Use Case" template will also be displayed at the top. The workspace displays "Use Case" as a watermark. The tree view will add an icon representing the chart.
Note If you do not see the tree view, point to View on the UML menu, and then click Model Explorer.
3. Drag the "System Boundary" shape onto the drawing page.
Use system boundary shape
Indicate system boundaries in use case diagrams
4. When drawing a UML use case diagram in Visio, drag the "Use Case" shape from the "Use Case" mold and place it within the system boundary, and then drag the "Participant" shape outside the system boundary.
Using use case shapes
Use participant shape
5. Use the "Communication" shape to indicate the relationship between use cases and actors.
Use communication shapes
Point out the relationship between actors and use cases
6. When drawing UML use case diagrams in Visio, you need to point out the relationship between use cases through the "use" and "extend" shapes.
Point out the usage relationship between the two use cases and point out the extension relationship between the two use cases
7. Double-click any shape (except the "System Boundary" shape) to open its "UML Properties" dialog box, where you can add names, properties, operations, and other properties.
8. Save the chart.
The above is the detailed content of PowerDesigner User Guide: Draw use case diagrams, sequence diagrams, collaboration diagrams, state diagrams and activity diagrams. For more information, please follow other related articles on the PHP Chinese website!

 Why You Should Always Rename Worksheets in ExcelApr 17, 2025 am 12:56 AM
Improve Excel’s productivity: A guide to efficient naming worksheets This article will guide you on how to effectively name Excel worksheets, improve productivity and enhance accessibility. Clear worksheet names significantly improve navigation, organization, and cross-table references. Why rename Excel worksheets? Using the default "Sheet1", "Sheet2" and other names is inefficient, especially in files containing multiple worksheets. Clearer names like “Dashboard,” “Sales,” and “Forecasts,” give you and others a clear picture of the workbook content and quickly find the worksheets you need. Use descriptive names (such as "Dashboard", "Sales", "Forecast")
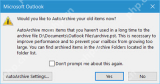 How to archive in Outlook automatically or manuallyApr 16, 2025 am 11:48 AM
This comprehensive guide explains how to effectively manage your Outlook email storage by archiving emails, tasks, and other items across various Outlook versions (365, 2021, 2019, 2016, 2013, and earlier). Learn to configure automatic archiving, pe
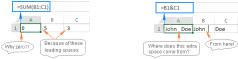
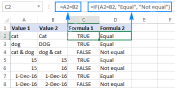 Excel: Compare strings in two cells for matches (case-insensitive or exact)Apr 16, 2025 am 11:26 AM
The tutorial shows how to compare text strings in Excel for case-insensitive and exact match. You will learn a number of formulas to compare two cells by their values, string length, or the number of occurrences of a specific character, a
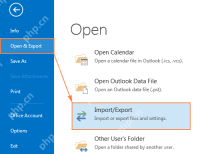 How to back up Outlook emails automatically or manuallyApr 16, 2025 am 11:17 AM
This comprehensive guide ensures your Outlook data remains safe and accessible. Learn how to back up Outlook emails, contacts, calendar entries, and tasks—both automatically and manually—across all Outlook 365 and 2010 versions. The importance of re
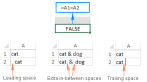
 Excel TRIM function - quick way to remove extra spacesApr 16, 2025 am 10:16 AM
This tutorial shows you quick and easy ways to remove extra spaces in Excel. Learn how to eliminate leading, trailing, and excess spaces between words, troubleshoot the TRIM function, and discover alternative solutions. Facing duplicate detection fa
 How to remove blank spaces in Excel - leading, trailing, non-breakingApr 16, 2025 am 09:05 AM
This tutorial shows you how to eliminate unwanted spaces in Excel using formulas and the handy Text Toolkit. Learn to remove leading and trailing spaces, extra spaces between words, non-breaking spaces, and other non-printing characters. The biggest
 5 Open-Source Alternatives to Microsoft ExcelApr 16, 2025 am 12:56 AM
Excel remains popular in the business world, thanks to its familiar interfaces, data tools and a wide range of feature sets. Open source alternatives such as LibreOffice Calc and Gnumeric are compatible with Excel files. OnlyOffice and Grist provide cloud-based spreadsheet editors with collaboration capabilities. Looking for open source alternatives to Microsoft Excel depends on what you want to achieve: Are you tracking your monthly grocery list, or are you looking for tools that can support your business processes? Here are some spreadsheet editors for a variety of use cases. Excel remains a giant in the business world Microsoft Ex
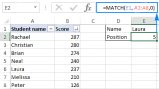 Excel MATCH function with formula examplesApr 15, 2025 am 11:21 AM
This tutorial explains how to use MATCH function in Excel with formula examples. It also shows how to improve your lookup formulas by a making dynamic formula with VLOOKUP and MATCH. In Microsoft Excel, there are many different lookup/ref


Hot AI Tools

Undresser.AI Undress
AI-powered app for creating realistic nude photos

AI Clothes Remover
Online AI tool for removing clothes from photos.

Undress AI Tool
Undress images for free

Clothoff.io
AI clothes remover

AI Hentai Generator
Generate AI Hentai for free.

Hot Article
Hot Tools

ZendStudio 13.5.1 Mac
Powerful PHP integrated development environment

DVWA
Damn Vulnerable Web App (DVWA) is a PHP/MySQL web application that is very vulnerable. Its main goals are to be an aid for security professionals to test their skills and tools in a legal environment, to help web developers better understand the process of securing web applications, and to help teachers/students teach/learn in a classroom environment Web application security. The goal of DVWA is to practice some of the most common web vulnerabilities through a simple and straightforward interface, with varying degrees of difficulty. Please note that this software

SublimeText3 English version
Recommended: Win version, supports code prompts!

WebStorm Mac version
Useful JavaScript development tools

SublimeText3 Linux new version
SublimeText3 Linux latest version

