Home >Web Front-end >H5 Tutorial >HTML5 SVG 2D Introduction 4—Stroke and Fill_html5 Tutorial Skills
HTML5 SVG 2D Introduction 4—Stroke and Fill_html5 Tutorial Skills
- WBOYWBOYWBOYWBOYWBOYWBOYWBOYWBOYWBOYWBOYWBOYWBOYWBOriginal
- 2016-05-16 15:50:081473browse
Earlier we focused on summarizing various shapes, texts and pictures. Next, we will summarize the color processing, that is, the fill and border effects, just like we discussed canvas. You will find that the content here is basically the same as that of canvas. Consistent. These attributes can be written in the element as attributes or saved in CSS (this is different from canvas).
Fill color - fill attribute
This attribute uses the set color to fill the inside of the graphic. It is very simple to use. Just assign the color value to this attribute directly. Look at the example:
In the above example, a rectangle with red and blue edges is drawn. Note a few points:
1. If the fill attribute is not provided, black fill will be used by default. If you want to cancel the filling, you need to set it to none.
2. You can set the fill transparency, which is fill-opacity. The value range is 0 to 1.
3. A little more complicated is the fill-rule attribute. This attribute defines the algorithm for judging whether a point belongs to the filling range; in addition to the value inherit, there are two values: nonzero: The algorithm used for this value is: launch a line from the point to be determined in any direction, and then calculate the direction of the intersection of the graph and the line segment; the calculation result starts from 0, and every intersection If the line segment at the intersection is from left to right, add 1; for each intersection point where the line segment is from right to left, decrease 1; after calculating all the intersection points, if the result of this calculation is not equal to 0, then the If the point is within the graphic, it needs to be filled; if the value is equal to 0, it is outside the graphic and does not need to be filled. Look at the example below:
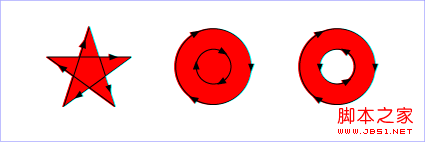
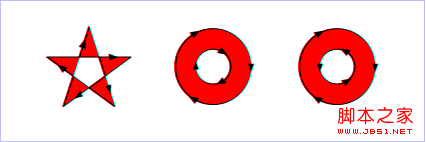
Border color - stroke attribute
The stroke attribute has been used in the above example. This attribute uses the set value to draw the border of the graphic. It is also very straightforward to use. Just assign the color value to it. Note:
1. If the stroke attribute is not provided, the graphic border will not be drawn by default.
2. You can set the transparency of the edge, which is stroke-opacity. The value range is 0 to 1.
Actually, the edge situation is a little more complicated than inside the graph, because in addition to the color, the edge also has a "shape" that needs to be defined.
Endpoint of the line - stroke-linecap attribute
This attribute defines the style of the endpoint of the line segment. This attribute can use butt, square, round Three values. Look at the example:
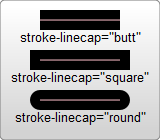
This code draws 3 lines using different style line endpoints,
From the picture on the left, we can easily see the differences in the 3 styles.
Line connection - stroke-linejoin attribute
This attribute defines the style of the line segment connection. This attribute can use three miter, round, bevel value. Look at the example:
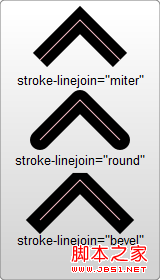
From the picture on the left, we can easily see the difference in the 3 styles.
The virtual and solid line - stroke-dasharray attribute
This attribute can set the virtual and solid line used for the line segment. Look at the example:
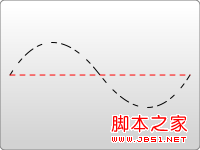
This attribute sets a series of numbers, but these numbers must be separated by commas.
Attributes can of course contain spaces, but spaces do not serve as separators. Each number
defines the length of the solid line segment, which is cycled in the order of drawing and not drawing.
So the line drawn in the example on the left is a solid line of 5 units, leaving 5 units of space,
Draw another 5 units of solid line...and continue like this.
In addition to these commonly used attributes, there are also the following attributes that can be set:
stroke-miterlimit: This is the same as in canvas. It handles the miter effect at the connection between when drawing and not drawing lines. .
stroke-dashoffset: This attribute sets the position where the dashed line starts to be drawn.
Use CSS to display data
HTML5 strengthens the idea of DIV CSS, so the data display part can also be left to CSS. Compared with ordinary HTML elements, it is just that background-color and border are replaced by fill and stroke. Most others are pretty much the same. Let’s take a simple example:
#MyRect:hover {
stroke: black;
fill: blue;
}
Isn’t it familiar? It’s that simple.
Practical reference:
Script index: http://msdn.microsoft.com/zh-cn/library/ff971910(v=vs.85).aspx
Development Center: https://developer.mozilla.org/en/SVG
Popular Reference: http://www.chinasvg.com/
Official documentation: http://www.w3.org/TR/SVG11/
Related articles
See more- AlloyTouch full-screen scrolling plug-in creates a smooth H5 page in 30 seconds
- HTML5 actual combat and analysis of touch events (touchstart, touchmove and touchend)
- Detailed explanation of image drawing examples in HTML5 canvas 9
- Regular expressions and new HTML5 elements
- How to combine NodeJS and HTML5 to drag and drop multiple files to upload to the server

