


Nine commonly used Python feature importance analysis methods

Feature importance analysis is used to understand the usefulness or value of each feature (variable or input) in making predictions. The goal is to identify the most important features that have the greatest impact on the model output, and it is a method often used in machine learning.
Why is feature importance analysis important?
If there is a feature containing dozens or even numbers A dataset of hundreds of features, each of which may contribute to the performance of your machine learning model. But not all features are created equal. Some may be redundant or irrelevant, which increases modeling complexity and may lead to overfitting.
Feature importance analysis can identify and focus on the most informative features, resulting in several advantages: 1. Provide insights: By analyzing the importance of features, we can gain insights into which features in the data have the greatest impact on the results, thus helping us better understand the nature of the data. 2. Optimize the model: By identifying key features, we can optimize the performance of the model, reduce unnecessary computing and storage overhead, and improve the training and prediction efficiency of the model. 3. Feature selection: Feature importance analysis can help us select the features with the most predictive power, thereby improving the accuracy and generalization ability of the model. 4. Explain the model: Feature importance analysis can also help us explain the prediction results of the model, reveal the patterns and causal relationships behind the model, and enhance the interpretability of the model
- Improvement Model performance
- Reduced overfitting
- Faster training and inference
- Enhanced Interpretability
# Let’s take a deeper look at some methods of feature importance analysis in Python.
Feature Importance Analysis Method
1. Permutation ImportancePermutationImportance
This method The values of each feature are randomly arranged, and then the degree of model performance degradation is monitored. If the decrease is larger, it means that the feature is more important
from sklearn.datasets import load_breast_cancer from sklearn.ensemble import RandomForestClassifier from sklearn.inspection import permutation_importance from sklearn.model_selection import train_test_split import matplotlib.pyplot as plt cancer = load_breast_cancer() X_train, X_test, y_train, y_test = train_test_split(cancer.data, cancer.target, random_state=1) rf = RandomForestClassifier(n_estimators=100, random_state=1) rf.fit(X_train, y_train) baseline = rf.score(X_test, y_test) result = permutation_importance(rf, X_test, y_test, n_repeats=10, random_state=1, scoring='accuracy') importances = result.importances_mean # Visualize permutation importances plt.bar(range(len(importances)), importances) plt.xlabel('Feature Index') plt.ylabel('Permutation Importance') plt.show()

2. Built-in feature importance (coef_ or feature_importances_)
Some models, such as linear regression and random forests, can directly output feature importance scores. These show the contribution of each feature to the final prediction.
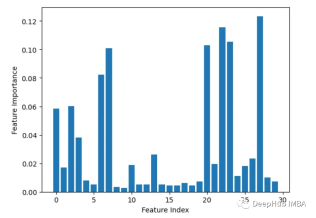
from sklearn.datasets import load_breast_cancer from sklearn.ensemble import RandomForestClassifier X, y = load_breast_cancer(return_X_y=True) rf = RandomForestClassifier(n_estimators=100, random_state=1) rf.fit(X, y) importances = rf.feature_importances_ # Plot importances plt.bar(range(X.shape[1]), importances) plt.xlabel('Feature Index') plt.ylabel('Feature Importance') plt.show()
3. Leave-one-out
Iteratively delete one feature at a time and evaluate accuracy.
from sklearn.datasets import load_breast_cancer from sklearn.model_selection import train_test_split from sklearn.ensemble import RandomForestClassifier from sklearn.metrics import accuracy_score import matplotlib.pyplot as plt import numpy as np # Load sample data X, y = load_breast_cancer(return_X_y=True) # Split data into train and test sets X_train, X_test, y_train, y_test = train_test_split(X, y, test_size=0.3, random_state=1) # Train a random forest model rf = RandomForestClassifier(n_estimators=100, random_state=1) rf.fit(X_train, y_train) # Get baseline accuracy on test data base_acc = accuracy_score(y_test, rf.predict(X_test)) # Initialize empty list to store importances importances = [] # Iterate over all columns and remove one at a time for i in range(X_train.shape[1]):X_temp = np.delete(X_train, i, axis=1)rf.fit(X_temp, y_train)acc = accuracy_score(y_test, rf.predict(np.delete(X_test, i, axis=1)))importances.append(base_acc - acc) # Plot importance scores plt.bar(range(len(importances)), importances) plt.show()

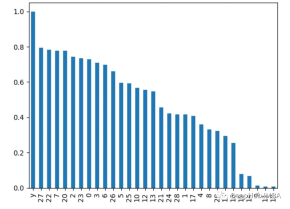
4. Correlation analysis
The content that needs to be rewritten is: Calculation features and goals Correlation between variables, the higher the correlation, the more important the feature
import pandas as pd from sklearn.datasets import load_breast_cancer X, y = load_breast_cancer(return_X_y=True) df = pd.DataFrame(X, columns=range(30)) df['y'] = y correlations = df.corrwith(df.y).abs() correlations.sort_values(ascending=False, inplace=True) correlations.plot.bar()
##5. Recursive Feature Elimination
Recursively remove features and see how it affects model performance. Features that result in larger drops when removed are more important.
from sklearn.ensemble import RandomForestClassifier from sklearn.feature_selection import RFE import pandas as pd from sklearn.datasets import load_breast_cancer import matplotlib.pyplot as plt X, y = load_breast_cancer(return_X_y=True) df = pd.DataFrame(X, columns=range(30)) df['y'] = y rf = RandomForestClassifier() rfe = RFE(rf, n_features_to_select=10) rfe.fit(X, y) print(rfe.ranking_)
The output is [6 4 11 12 7 11 18 21 8 16 10 3 15 14 19 17 20 13 11 11 12 9 11 5 11]
6. XGBoost feature importance
Calculate the number of times a feature is used in splitting data. This feature is used in all trees. More splits mean more important
import xgboost as xgb import pandas as pd from sklearn.datasets import load_breast_cancer import matplotlib.pyplot as plt X, y = load_breast_cancer(return_X_y=True) df = pd.DataFrame(X, columns=range(30)) df['y'] = y model = xgb.XGBClassifier() model.fit(X, y) importances = model.feature_importances_ importances = pd.Series(importances, index=range(X.shape[1])) importances.plot.bar()

7. Principal component analysis PCA
pair Perform principal component analysis on the features and view the explained variance ratio of each principal component. Characteristics with higher loads on the first few components are more important.
from sklearn.decomposition import PCA import pandas as pd from sklearn.datasets import load_breast_cancer import matplotlib.pyplot as plt X, y = load_breast_cancer(return_X_y=True) df = pd.DataFrame(X, columns=range(30)) df['y'] = y pca = PCA() pca.fit(X) plt.bar(range(pca.n_components_), pca.explained_variance_ratio_) plt.xlabel('PCA components') plt.ylabel('Explained Variance')

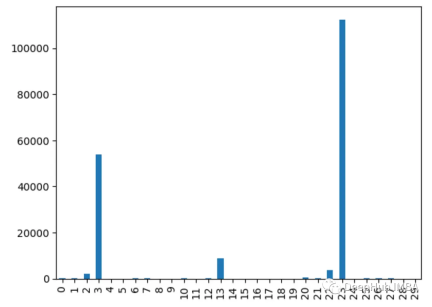
8. Analysis of variance ANOVA
Use f_classif() to obtain the analysis of variance of each feature f value. The higher the f value, the stronger the correlation between the feature and the target.
from sklearn.feature_selection import f_classif import pandas as pd from sklearn.datasets import load_breast_cancer import matplotlib.pyplot as plt X, y = load_breast_cancer(return_X_y=True) df = pd.DataFrame(X, columns=range(30)) df['y'] = y fval = f_classif(X, y) fval = pd.Series(fval[0], index=range(X.shape[1])) fval.plot.bar()

9. Chi-square test
Use the chi2() function to obtain the value of each feature Chi-square statistics. Features with higher scores are more likely to be independent of the target variable
from sklearn.feature_selection import chi2 import pandas as pd from sklearn.datasets import load_breast_cancer import matplotlib.pyplot as plt X, y = load_breast_cancer(return_X_y=True) df = pd.DataFrame(X, columns=range(30)) df['y'] = y chi_scores = chi2(X, y) chi_scores = pd.Series(chi_scores[0], index=range(X.shape[1])) chi_scores.plot.bar()
为什么不同的方法会检测到不同的特征?
由于不同的特征重要性方法,有时可以确定哪些特征是最重要的
1、他们用不同的方式衡量重要性:
有的使用不同特特征进行预测,监控精度下降
像XGBOOST或者回归模型使用内置重要性来进行特征的重要性排序
而PCA着眼于方差解释
2、不同模型有不同模型的方法:
线性模型偏向于处理线性关系,而树模型则更倾向于捕捉接近根节点的特征
3、交互作用:
有些方法可以获取特征之间的相互关系,而有些方法则不行,这会导致结果的不同
3、不稳定:
使用不同的数据子集,重要性值可能在同一方法的不同运行中有所不同,这是因为数据差异决定的
4、Hyperparameters:
通过调整超参数,例如主成分分析(PCA)组件或决策树的深度,也会对结果产生影响
所以不同的假设、偏差、数据处理和方法的可变性意味着它们并不总是在最重要的特征上保持一致。
选择特征重要性分析方法的一些最佳实践
- 尝试多种方法以获得更健壮的视图
- 聚合结果的集成方法
- 更多地关注相对顺序,而不是绝对值
- 差异并不一定意味着有问题,检查差异的原因会对数据和模型有更深入的了解
The above is the detailed content of Nine commonly used Python feature importance analysis methods. For more information, please follow other related articles on the PHP Chinese website!

 How to Run LLM Locally Using LM Studio? - Analytics VidhyaApr 19, 2025 am 11:38 AM
Running large language models at home with ease: LM Studio User Guide In recent years, advances in software and hardware have made it possible to run large language models (LLMs) on personal computers. LM Studio is an excellent tool to make this process easy and convenient. This article will dive into how to run LLM locally using LM Studio, covering key steps, potential challenges, and the benefits of having LLM locally. Whether you are a tech enthusiast or are curious about the latest AI technologies, this guide will provide valuable insights and practical tips. Let's get started! Overview Understand the basic requirements for running LLM locally. Set up LM Studi on your computer
 Guy Peri Helps Flavor McCormick's Future Through Data TransformationApr 19, 2025 am 11:35 AM
Guy Peri is McCormick’s Chief Information and Digital Officer. Though only seven months into his role, Peri is rapidly advancing a comprehensive transformation of the company’s digital capabilities. His career-long focus on data and analytics informs
 What is the Chain of Emotion in Prompt Engineering? - Analytics VidhyaApr 19, 2025 am 11:33 AM
Introduction Artificial intelligence (AI) is evolving to understand not just words, but also emotions, responding with a human touch. This sophisticated interaction is crucial in the rapidly advancing field of AI and natural language processing. Th
 12 Best AI Tools for Data Science Workflow - Analytics VidhyaApr 19, 2025 am 11:31 AM
Introduction In today's data-centric world, leveraging advanced AI technologies is crucial for businesses seeking a competitive edge and enhanced efficiency. A range of powerful tools empowers data scientists, analysts, and developers to build, depl
 AV Byte: OpenAI's GPT-4o Mini and Other AI InnovationsApr 19, 2025 am 11:30 AM
This week's AI landscape exploded with groundbreaking releases from industry giants like OpenAI, Mistral AI, NVIDIA, DeepSeek, and Hugging Face. These new models promise increased power, affordability, and accessibility, fueled by advancements in tr
 Perplexity's Android App Is Infested With Security Flaws, Report FindsApr 19, 2025 am 11:24 AM
But the company’s Android app, which offers not only search capabilities but also acts as an AI assistant, is riddled with a host of security issues that could expose its users to data theft, account takeovers and impersonation attacks from malicious
 Everyone's Getting Better At Using AI: Thoughts On Vibe CodingApr 19, 2025 am 11:17 AM
You can look at what’s happening in conferences and at trade shows. You can ask engineers what they’re doing, or consult with a CEO. Everywhere you look, things are changing at breakneck speed. Engineers, and Non-Engineers What’s the difference be
 Rocket Launch Simulation and Analysis using RocketPy - Analytics VidhyaApr 19, 2025 am 11:12 AM
Simulate Rocket Launches with RocketPy: A Comprehensive Guide This article guides you through simulating high-power rocket launches using RocketPy, a powerful Python library. We'll cover everything from defining rocket components to analyzing simula


Hot AI Tools

Undresser.AI Undress
AI-powered app for creating realistic nude photos

AI Clothes Remover
Online AI tool for removing clothes from photos.

Undress AI Tool
Undress images for free

Clothoff.io
AI clothes remover

Video Face Swap
Swap faces in any video effortlessly with our completely free AI face swap tool!

Hot Article
Hot Tools

Notepad++7.3.1
Easy-to-use and free code editor

Atom editor mac version download
The most popular open source editor

VSCode Windows 64-bit Download
A free and powerful IDE editor launched by Microsoft

Safe Exam Browser
Safe Exam Browser is a secure browser environment for taking online exams securely. This software turns any computer into a secure workstation. It controls access to any utility and prevents students from using unauthorized resources.

ZendStudio 13.5.1 Mac
Powerful PHP integrated development environment

