
Home >Web Front-end >JS Tutorial >Top 8 Free JavaScript Libraries for Visualizing Graphs
Top 8 Free JavaScript Libraries for Visualizing Graphs

- WBOYWBOYWBOYWBOYWBOYWBOYWBOYWBOYWBOYWBOYWBOYWBOYWBOriginal
- 2023-09-03 21:53:013289browse
When dealing with large amounts of data, you may encounter situations where you must represent the data visually with the help of charts.
A graph is a structure of a set of objects, where certain pairs of objects are "related" in some sense. They are basically mathematical structures used to model pairwise relationships between objects. (Wikipedia)
If you implement everything yourself, visually representing your data in a graph will require you to spend a lot of time writing code to deal with the graph structure. In this article, we created a list of some of the best free JavaScript graph visualization libraries that will do all the heavy lifting for you.
People often use the terms "graph" and "chart" interchangeably. If you are looking for these libraries instead of graph visualization libraries, we also have a list of the best free JavaScript charting libraries for you.
1. D3.js
Whenever you are doing something related to any kind of data visualization in the form of charts or graphs, the first library that comes to mind is D3.js. D3 stands for Data Driven Document. It uses a combination of HTML, SVG, and CSS to create visual representations of data.
This library basically allows you to bind arbitrary data to the DOM. Afterwards, all types of charts and graphs can be created from this data. This library gives you access to different methods and functions that can be used to select elements. It also allows you to dynamically set attribute values of different elements based on given data.
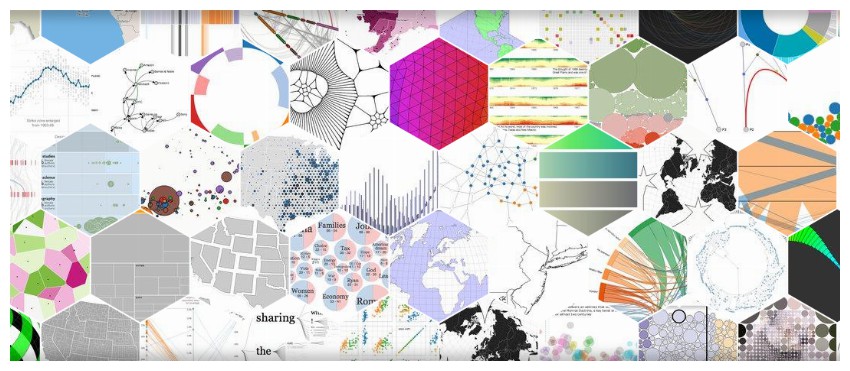
You can visit the D3 Gallery to see all the possibilities. It contains a bunch of different charts and graphs to show you what D3.js is capable of.
One important thing to remember is that the library has no built-in methods to help you create any bar chart or chart directly by calling a single method. You must implement this functionality yourself. However, it comes with a number of helper functions that can help you do all of these things with relative ease.
2. Neo4j
As I mentioned before, D3.js is a powerful library for creating all kinds of graphs and charts. However, it requires a lot of work on your part to create any kind of graphical visualization. One way to overcome this limitation is to use a D3.js-based helper library, which does all the basic heavy lifting for you.
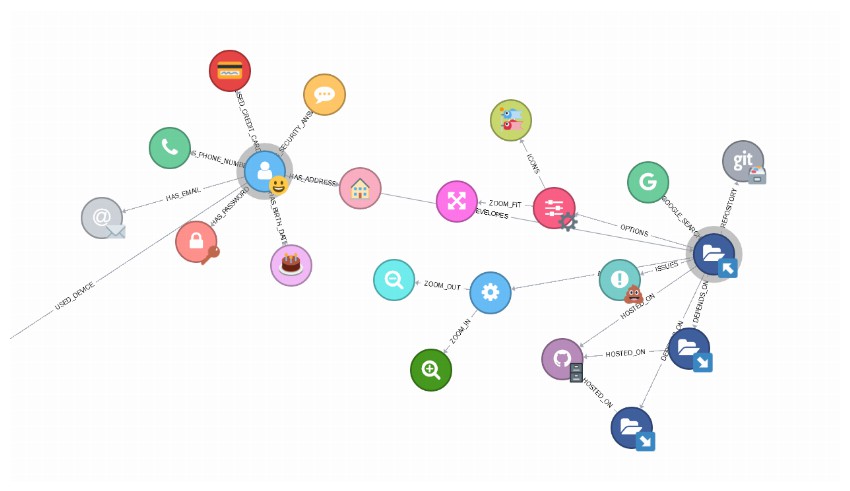
Neo4j is an example of such a library. It comes with several useful features such as compatibility with multiple data formats, force simulation, double-click callbacks, and custom node colors based on node type. You can also display information about different nodes and their relationships in the information panel.
You can zoom and pan the chart. The library also features auto-adaptation and relationship auto-orientation. Dragging a node makes it sticky, and clicking it again returns it to its initial non-sticky state.
You can also provide callbacks for different events using options such as onNodeClick, onNodeDoubleClick, onNodeDragStart, onNodeDragEnd, etc. The example on the website adds a bunch of new nodes appended to the original node on each node. Double click event.
3. React D3 Graph
React D3 Graph is another graph generation library based on D3.js that allows you to create interactive and configurable graphs using React.
The library comes with a main graph component, once you pass all the relevant data to it you can build the actual graph. You can also optionally provide configuration information as well as callback functions to handle user events such as node clicks and link clicks.
Please keep in mind that this library is not pre-packaged with React and D3.js. You must install these libraries separately. This gives you the freedom to independently select individual versions of the library, as long as they are above the minimum requirements.
You can specify a number of configuration options for each chart, such as making it directional, focus scaling, changing the animation duration during focus, or using pan and zoom behavior. You can also disable any drag-and-drop related chart operations or make the chart completely static.
4. VivaGraphJS
VivaGraphJS is a dependency-free library that can be used to render graphics. The library is extensible and supports multiple rendering engines and layout algorithms. There are many related modules you can install to add the required functionality to your charts. This includes support for basic events, force-guided graph layout, and storing graph data in JSON format.
This library provides many customization options. You can easily change the appearance of nodes and links. Likewise, you have full control over the layout algorithm and the medium used to display your graphics. For example, you can tell the library to use WebGL to render graphics instead of the default SVG.
Any graph you render on a web page will have a different structure based on factors such as the number of nodes, number of connected edges, etc. You can use a bunch of parameters, such as springLength, springCoeff, and gravity, to tweak the physics so that your rendered charts look great.
5. Graphology
The Graphology library is a powerful and versatile package written in JavaScript and TypeScript. The purpose of this library is to add support for multiple types of graphics using the same unified interface. This allows you to create a variety of directed, undirected or hybrid graphs. You can also decide whether to allow self-looping or support features such as parallel edges.
Graphs created using graphics can emit events for various operations, such as adding or removing nodes and adding or removing edges. There are also events that are triggered by node or edge attribute updates.
You can also include a number of standard helper libraries in your project for additional functionality. This includes things like the canvas package for rendering on canvas or the shortest path package with functions for applying common search algorithms such as Dijkstra's algorithm.
Sigma.js is a standalone library that works well with graphology. It gives you access to the WebGL renderer and helps you create interactive graphics.
6. Cytoscape.js
Cytoscape.js is another excellent library for graph theory visualization and data analysis. You can use it to visualize various relational data, such as social network connections or biometric data. The library comes with a graph theory model and an optional renderer to display your interactive charts. It is an all-in-one software package that can meet all your drawing needs.
The library is highly optimized and has good browser support. Browser support goes back to IE10, with partial support for IE9. All modern browsers enjoy excellent support. The library also supports using selectors for filtering and graph queries, and using stylesheets to separate data from presentation.
There is built-in support for standard gestures on both desktop and mobile devices. It supports set theoretical operations and includes graph theory algorithms such as BFS and PageRank. You can be assured of the quality of this library as it is used by large companies like Amazon and Google, as well as government organizations.
You can read the Cytoscape.js documentation to get started using the library.
7.Arbor
Arbor is a simple graph visualization library built using Web Workers and the jQuery library as a foundation.
Unlike some of the other libraries on this list, Arbor does not aim to be a complete all-in-one solution. It simply provides an efficient, force-directed layout algorithm and other abstractions for graph organization.
It also has built-in support for handling screen refresh events. This simply means that the rendering of data on the web page is done by the developer. You are free to create diagrams using canvas, SVG or HTML elements depending on the needs of your project.
8.Strive to try
You can use the Force Graph library to render force-directed graphs on the HTML5 canvas. While the library uses the HTML5 canvas for rendering, it relies on the D3 force library to handle the underlying physics. Supports zooming and panning on the canvas. You can also drag nodes or listen to click and hover events for nodes and their links.
There are many ways to control the style of nodes and links. You can also use a range of methods to control how different elements of the graph are rendered.
What if you want to render your chart in 3D? Fortunately, there is also a 3D version of the library that relies on WebGL and Three.js to handle rendering. The underlying physics of the graph is taken care of by the D3 Force 3D library or the ngraph library.
Final Thoughts
Visualizing complex data in the form of charts can help us easily understand the relationships between different entities. Charts will help you communicate data that is too large and complex to be easily explained with textual information alone.
In this article, we give you a brief overview of some of the most popular JavaScript libraries that help you visualize information in the form of charts. One of these libraries may meet the needs of your project. However, you can also search for graph visualization libraries on GitHub for more options.
Post thumbnail generated by OpenAI DALL-E.
The above is the detailed content of Top 8 Free JavaScript Libraries for Visualizing Graphs. For more information, please follow other related articles on the PHP Chinese website!
Related articles
See more- An in-depth analysis of the Bootstrap list group component
- Detailed explanation of JavaScript function currying
- Complete example of JS password generation and strength detection (with demo source code download)
- Angularjs integrates WeChat UI (weui)
- How to quickly switch between Traditional Chinese and Simplified Chinese with JavaScript and the trick for websites to support switching between Simplified and Traditional Chinese_javascript skills