Home >Technology peripherals >It Industry >Visual Studio Code launches a new feature: officially supports the CMake debugger!
Visual Studio Code launches a new feature: officially supports the CMake debugger!
- 王林forward
- 2023-08-13 22:01:021178browse
Microsoft recently announced its cooperation with Kitware to introduce a new CMake debugger in the latest CMake 3.27 version and successfully integrated it into Visual Studio Code to provide developers with a more convenient debugging experience
Recently, Microsoft cooperated with Kitware to integrate the CMake Debugger (CMake Debugger) into the CMake 3.27 version, allowing VS Code users to also use this debugging tool that was previously limited to Visual Studio, thereby greatly expanding the scope of the debugging tool

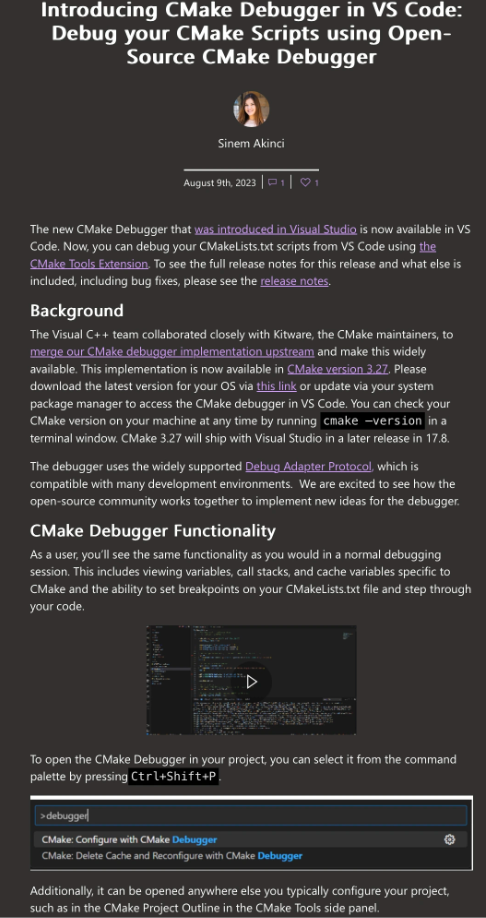
According to the editor’s understanding, users can now set breakpoints in the CMakeLists.txt file through the CMake debugger in CMake 3.27 version, and can easily execute and skip Or exit the breakpoint, thereby making the debugging process more flexible and efficient
The CMake debugger is powerful because it adopts the Debug Adapter Protocol (DAP) of the open protocol, making it compatible with a variety of development environments. Provides developers with more opportunities to choose
Through the call stack function, developers can view and debug problems related to file names and codes in detail, and can decide when the debugger encounters errors and warnings as needed. Whether to automatically interrupt to better optimize the project code
The above is the detailed content of Visual Studio Code launches a new feature: officially supports the CMake debugger!. For more information, please follow other related articles on the PHP Chinese website!

