Home >Operation and Maintenance >Safety >Uber Practice: Some experiences in operating and maintaining large-scale distributed systems
Uber Practice: Some experiences in operating and maintaining large-scale distributed systems
- WBOYWBOYWBOYWBOYWBOYWBOYWBOYWBOYWBOYWBOYWBOYWBOYWBforward
- 2023-06-09 16:53:49869browse
This article is written by Gergely Orosz, an engineer at Uber. The original address is: https://blog.pragmaticengineer.com/operating-a-high-scale-distributed-system/
For the past few years, I have been building and operating a large distributed system: Uber’s payment system. During this period, I learned a lot about distributed architecture concepts and witnessed first-hand the challenges of running high-load and high-availability systems (a system is far from finished when it is developed, and the challenges of running it online are actually even greater). Building the system itself is an interesting endeavor. Planning how the system will handle 10x/100x traffic increases, ensuring data durability, handling hardware failures, etc. all require wisdom. Regardless, operating large distributed systems has been an eye-opening experience for me.
The larger the system, the more Murphy’s law of “what can go wrong, will go wrong” becomes apparent. There are many developers deploying and deploying code frequently, multiple data centers are involved, and the system is used by a large number of global users, the greater the probability of such errors. Over the past few years, I've experienced a variety of system failures, many of which surprised me. Some come from predictable things, such as hardware failures or seemingly harmless bugs, as well as data center cables being dug out and multiple cascading failures occurring simultaneously. I've experienced dozens of business outages where some part of the system didn't work properly, resulting in huge business impact.
This article is a collection of practices that I summarized while working at Uber that can effectively operate and maintain large systems. My experience is not unique - people working on similar sized systems have been on similar journeys. I talked to engineers at Google, Facebook, and Netflix, and they shared similar experiences and solutions. Many of the ideas and processes outlined here should apply to similarly sized systems, whether running on their own data centers (as Uber does in most cases) or in the cloud (Uber sometimes elastically deploys parts of its services to the cloud) superior). However, these practices may be too harsh for smaller or less mission-critical systems.
There's a lot to cover - I'll cover the following topics:
- Monitoring
- On duty, anomaly detection and alerting
- Fault and event management Process
- Post-mortem analysis, incident review and continuous improvement culture
- Failure drills, capacity planning and black box testing
- SLOs, SLAs and their reports
- SRE As an independent team
- Reliability as continuous investment
- More recommended reading
Monitoring
To know if the system is healthy, we need to answer " Is my system working properly?" question? To do this, collecting data on key parts of the system is crucial. For distributed systems with multiple services running on multiple computers and data centers, it can be difficult to determine what the key things to monitor are.
Infrastructure Health Monitoring If one or more computers/virtual machines are overloaded, some parts of the distributed system may degrade. The health status of the machine, CPU utilization, and memory usage are basic contents worth monitoring. Some platforms can handle this monitoring and auto-scaling instances out of the box. At Uber, we have an excellent core infrastructure team that provides infrastructure monitoring and alerting out of the box. No matter how it is implemented at the technical level, when there is a problem with the instance or infrastructure, the monitoring platform needs to provide necessary information.
Service health monitoring: traffic, errors, delays. We often need to answer the question "Is this backend service healthy?" Observing things like request traffic, error rates, and endpoint latency accessing endpoints can all provide valuable information about the health of your service. I prefer to have this all displayed on the dashboard. When building a new service, you can learn a lot about the system by using the correct HTTP response mapping and monitoring the relevant code. Therefore, ensuring that 4XX is returned on client errors, and 5xx on server errors, is easy to build and easy to interpret.
Monitoring latency is worth a second thought. For production services, the goal is for the majority of end users to have a good experience. It turns out that measuring average latency is not a very good metric because this average can hide a small percentage of high-latency requests. Measuring p95, p99 or p999 - the latency experienced by the 95th, 99th or 99.9th percentile requests - is a better metric. These numbers help answer questions like "How fast are 99% of people's requests?" (p99). or "How slow a delay does at least one person out of 1,000 experience?" (p999). For those more interested in this topic, this delayed primer article provides further reading.
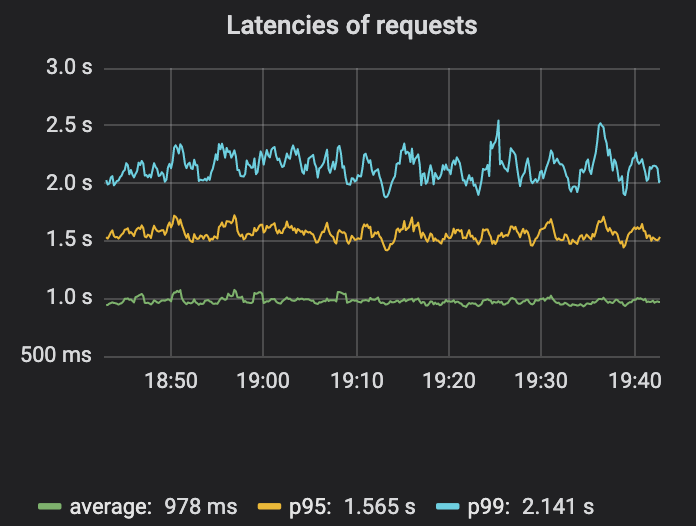
It can be clearly seen from the figure that the differences in average delay, p95, and p99 are quite large. So average latency may mask some issues.
There is a lot more in-depth content around monitoring and observability. Two resources worth reading are Google's SRE book and the section on the Four Golden Metrics of Distributed Systems Monitoring. They recommend that if you can only measure four metrics for your user-facing system, focus on traffic, errors, latency, and saturation. For shorter material, I recommend the Distributed Systems Observability e-book from Cindy Sridharan, which covers other useful tools such as event logging, metrics, and tracing best practices.
Business indicator monitoring. Monitoring the service module can tell us how the service module is running normally, but it cannot tell us whether the business is working as expected and whether it is "business as usual." In payment systems, a key question is, "Can people use a specific payment method to make payments?". Identifying business events and monitoring them is one of the most important monitoring steps.
Although we established various monitoring, some business problems still could not be detected, which caused us great pain and finally established monitoring of business indicators. Sometimes all of our services appear to be running normally, but key product features are unavailable! This kind of monitoring is very useful for our organization and field. Therefore, we had to put a lot of thought and effort into customizing this type of monitoring ourselves, based on Uber's observability technology stack.
Translator's Note: We really feel the same way about business indicator monitoring. In the past, we sometimes found that all services were normal in Didi, but the business was not working properly. The Polaris system we are currently building to start a business is specifically designed to deal with this problem. Interested friends can leave me a message in the background of the official account, or add my friend picobyte to communicate and try it out.
Oncall, Anomaly Detection and Alerting
Monitoring is a great tool for gaining insight into the current state of your system. But this is just a stepping stone to automatically detecting problems and raising alerts for people to take action.
Oncall itself is a broad topic - Increment magazine covers many aspects in its "On-Call Issue". My strong opinion is that if you have a "you build it, you own it" mentality, OnCall will follow. The team that builds the services owns them and is responsible for on-calling them. Our team is on duty for payment services. So whenever an alarm occurs, the engineer on duty responds and reviews the details. But how do you go from monitoring to alerting?
Detecting anomalies from monitoring data is a difficult challenge and an area where machine learning can shine. There are many third-party services that provide anomaly detection. Fortunately again, our team had an in-house machine learning team to work with and they tailored the solution to Uber's usage. The New York-based Observability team wrote a helpful article explaining how Uber’s anomaly detection works. From my team's perspective, we push monitoring data to that team's pipeline and get alerts with respective confidence levels. We then decide if we should call an engineer.
When to trigger an alarm is an interesting question. Too few alerts can mean missing an impactful outage. Too much can lead to sleepless nights and exhaustion. Tracking and classifying alarms and measuring signal-to-noise ratio are critical to tuning alarm systems. Reviewing alerts and flagging them as actionable, then taking steps to reduce alerts that are not actionable, is a good step toward achieving a sustainable on-call rotation.
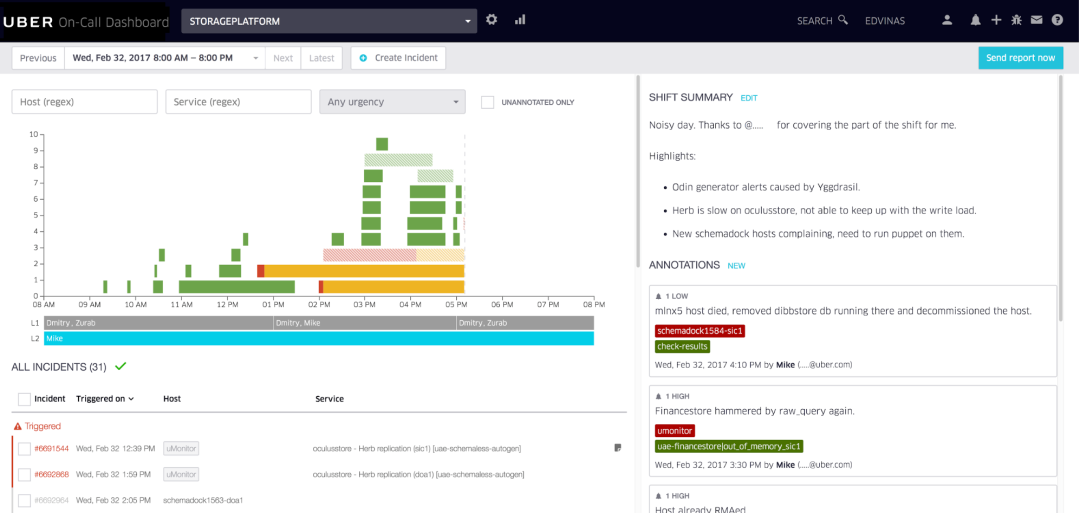
#Example of an internal oncall dashboard used by Uber, built by the Uber Developer Experience team at Vilnius.
The Uber Dev Tools team in Vilnius built a neat calling tool that we use to annotate alerts and visualize call shifts. Our team conducts weekly reviews of the last on-call shift, analyzes pain points and spends time improving the on-call experience, week after week.
Translator's Note: Alarm event aggregation, noise reduction, scheduling, claiming, upgrading, collaboration, flexible push strategy, multi-channel push, and IM connection are very common needs and can be Refer to the product FlashDuty, experience address: https://console.flashcat.cloud/
Fault and event management process
Imagine: you are the engineer on duty this week. In the middle of the night, an alarm wakes you up. You investigate whether a production outage occurred. Oops, it seems like there's something wrong with some part of the system. What should we do now? Monitoring and alerting actually happen.
For small systems, outages may not be a big deal and the engineer on duty can understand what is happening and why. They are usually easy to understand and easy to alleviate. For complex systems with multiple (micro)services and many engineers pushing code to production, just pinpointing where potential issues occur can be challenging enough. Having some standard processes to help solve this problem can make a huge difference.
A runbook attached to the alert describing simple mitigation steps is the first line of defense. For teams with good runbooks, even if the engineer on duty doesn't have a deep understanding of the system, it will rarely be a problem. Runbooks need to be kept current, updated, and use novel mitigations to handle failures when they occur.
Translator's Note: The alarm rule configuration of Nightingale and Grafana can support custom fields, but some additional fields are provided by default, such as RunbookUrl. The core is to convey the importance of the SOP manual. sex. In addition, in the stability management system, whether the alarm rules have preset RunbookUrl is a very important indicator of alarm health.
Once you have more than a few teams deploying services, communicating faults across the organization becomes critical. I work in an environment where thousands of engineers deploy services they develop into production at their own discretion, potentially hundreds of deployments per hour. A seemingly unrelated service deployment may impact another service. In this case, standardized fault broadcast and communication channels can go a long way. I had encountered multiple rare alert messages - and realized that people on other teams were seeing similar strange phenomena. By joining a centralized chat group to handle outages, we quickly identified the service causing the outage and resolved the issue. We got it done faster than any one person could.
Relieve now, investigate tomorrow. During a breakdown, I often get that "adrenaline rush" of wanting to fix what went wrong. Often the root cause is poor code deployment, with obvious bugs in the code changes. In the past, I would jump right in and fix the bug, push the fix, and close the bug instead of rolling back the code changes. However, fixing the root cause during a failure is a terrible idea. There is little gain and a lot of loss from using forward restoration. Because new fixes need to be done quickly, they must be tested in production. This is why a second error - or a glitch on top of an existing error - is introduced. I've seen glitches like this keep getting worse. Just focus on mitigation first and resist the urge to fix or investigate the root cause. Proper investigation can wait until the next business day.
Translator's Note: Veteran drivers should also be deeply aware of this. Do not debug online. If a problem occurs, roll back immediately instead of trying to release a hotfix version to fix it!
Post-mortem analysis, incident review and continuous improvement culture
This is about how a team handles the aftermath of a failure. Will they continue to work? Will they do a small survey? Will they spend a surprising amount of effort down the road, stopping product work to make a system-level fix?
Properly done post-mortem analysis is the cornerstone of building a strong system. A good postmortem is both non-accusatory and thorough. Uber’s post-mortem template continues to evolve with engineering technology and includes sections such as incident overview, impact overview, timeline, root cause analysis, lessons learned, and detailed follow-up checklist.
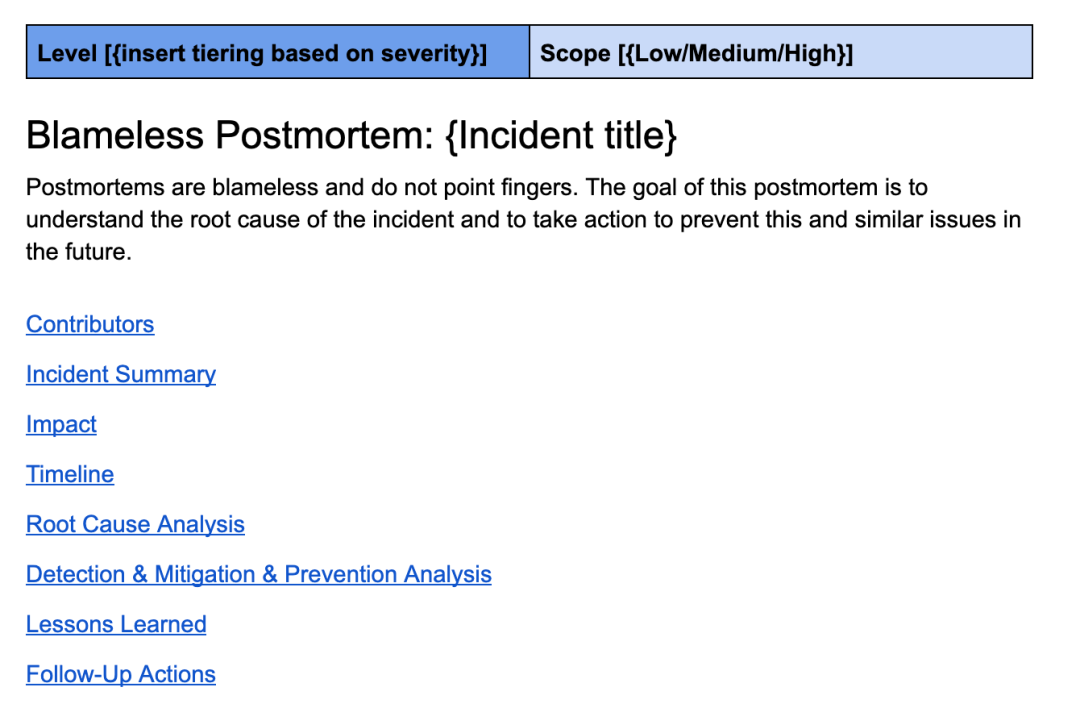
This is a review template similar to the one I use at Uber.
A good post-mortem digs deep into the root causes and suggests improvements to more quickly prevent, detect, or mitigate all similar failures. When I say dig deeper, I mean they don't stop at the root cause, which is the wrong code change and the code reviewer not catching the bug.
They use the “5why” exploration method to dig deeper to reach more meaningful conclusions. for example:
- Why does this problem occur? –> Because a bug was introduced into the code.
- Why didn't anyone else catch this bug? –> Code changes not noticed by code reviewers can cause such problems.
- Why do we rely only on code reviewers to catch this error? –> Because we don’t have automated tests for this use case.
- "Why don't we have automated tests for this use case?" –> Because it's difficult to test without a test account.
- Why don’t we have a test account? –> Because the system does not support them yet
- Conclusion: This issue points to a systemic issue with the lack of test accounts. It is recommended that test account support be added to the system. Next, write automated tests for all future similar code changes.
Event review is an important supporting tool for post-event analysis. While many teams are thorough in their post-mortem analysis, others can benefit from additional input and challenge for preventive improvements. It is also important that teams feel accountable and empowered to implement the system-level improvements they propose.
For organizations that take reliability seriously, the most serious failures are reviewed and challenged by experienced engineers. Engineering management at the organizational level should also be present to provide authority to complete repairs—especially if these repairs are time-consuming and impede other work. Robust systems don’t happen overnight: they are built through constant iteration. How can we continue to iterate? This requires a culture of continuous improvement and learning from failures at the organizational level.
Failure Drills, Capacity Planning and Black Box Testing
There are some routine activities that require significant investment but are critical to keeping large distributed systems up and running. These are concepts I was first exposed to at Uber—at previous companies, we didn’t need to use these because our scale and infrastructure didn’t push us to do so.
A data center failure drill was something I thought was boring until I observed a few of them in action. My initial thought was that designing robust distributed systems is precisely to be able to remain resilient in the event of a data center collapse. If it works fine in theory, why test it so often? The answer has to do with scale and the need to test whether the service can effectively handle the sudden increase in traffic in the new data center.
The most common failure scenario I observe is when a failover occurs and the service in the new data center does not have enough resources to handle global traffic. Assume that ServiceA and ServiceB are running from two data centers respectively. Assume resource utilization is 60%, with dozens or hundreds of virtual machines running in each data center, and set an alarm to trigger at 70%. Now let's do a failover and redirect all traffic from DataCenterA to DataCenterB. Without provisioning a new machine, DataCenterB suddenly couldn't handle the load. Provisioning a new machine can take long enough that requests pile up and start being dropped. This blocking may start affecting other services, causing cascading failures of other systems that are not even part of this failover.
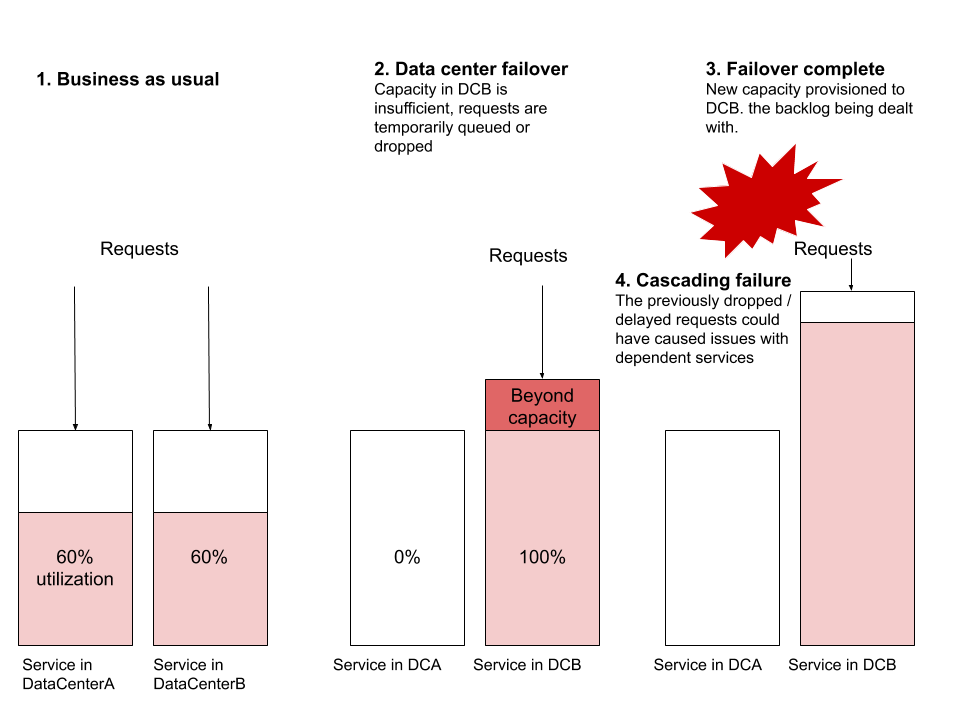
Other common failure scenarios include routing level issues, network capacity issues, or back pressure pain points. Data center failover is an exercise that any reliable distributed system should be able to perform without any user impact. I emphasize "should" - this exercise is one of the most useful exercises for testing the reliability of distributed systems.
Translator’s Note: Cutting traffic is one of the “three axes” of the plan. When something goes wrong, to ensure that the plan is available, drills are indispensable. Pay attention, fellows.
Planned service downtime exercises are an excellent way to test the resiliency of your entire system. These are also a great way to discover hidden dependencies or inappropriate/unintended uses of a specific system. While this exercise is relatively easy to accomplish for customer-facing services with few dependencies, it is not so easy for critical systems that require high availability or are relied upon by many other systems. But what happens when this critical system becomes unavailable one day? It’s best to validate answers through a controlled exercise where all teams are aware and prepared for unexpected disruptions.
Black box testing is a method of measuring the correctness of a system as close as possible to the conditions seen by the end user. This type of testing is similar to end-to-end testing, but for most products, having proper black-box testing requires a separate investment. Key user processes and the most common user-facing testing scenarios are examples of good black-box testability: set up in such a way that they can be triggered at any time to check that the system is working properly.
Taking Uber as an example, an obvious black box test is to check whether the passenger-driver process is working properly at the city level. That is, can a passenger within a specific city request an Uber, work with the driver, and complete the ride? Once this situation is automated, this test can be run periodically, simulating different cities. Having a powerful black box testing system makes it easier to verify that a system or part of a system is working correctly. It's also very helpful for failover drills: the quickest way to get failover feedback is to run black box tests.
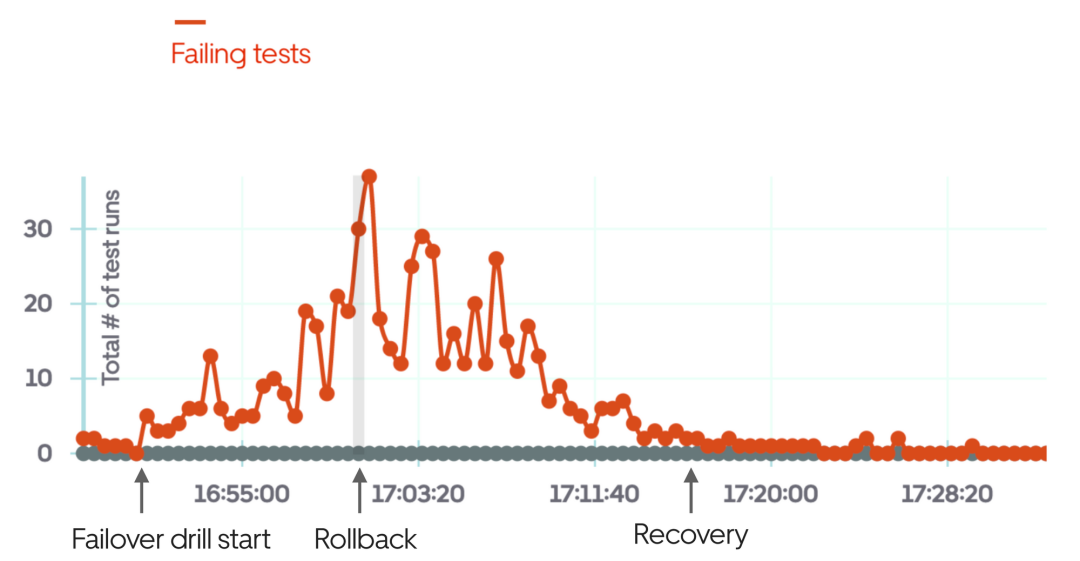
The above picture is an example of using black box testing when the failover drill fails and manually rolls back after a few minutes of the drill.
Capacity planning is equally important for large distributed systems. By large, I mean computing and storage costs reach tens or hundreds of thousands of dollars per month. At this scale, using a fixed number of deployments may be cheaper than using an auto-scaling cloud solution. At a minimum, fixed deployments should handle "business as usual" traffic and automatically scale during peak loads. But how many minimum instances do you need to run in the next month, the next three months, and next year?
Predicting future traffic patterns for a mature system with good historical data is not difficult. This is important for budgeting, choosing a vendor, or locking in a cloud provider discount. If your services are expensive and you're not thinking about capacity planning, you're missing out on simple ways to reduce and control costs.
SLOs, SLAs, and Related Reports
SLO stands for Service Level Objective - a numerical target for system availability. It is good practice to define service level SLOs (such as targets for capacity, latency, accuracy, and availability) for each individual service. These SLOs can then serve as triggers for alerts. An example service level SLO might look like this:
| ##SLO Metric
|
Subcategory |
Value for Service |
| Capacity |
Minumum throughput |
500 req/sec |
| Maximum expected throughput |
2,500 req/sec
|
|
| Latency |
Expected median response time |
50-90ms |
Expected p99 response time |
500-800ms |
|
Accuracy |
Maximum error rate |
0.5% |
Availability |
Guaranteed uptime |
99.9% |
Business-level SLO or functional SLO is an abstraction on top of services. They will cover user or business-oriented metrics. For example, a business-level SLO might look like this: Expect 99.99% of email receipts to be sent within 1 minute of a trip being completed. This SLO may be mapped to a service-level SLO (such as latency for payment and email receiving systems), or they may need to be measured differently.
SLA - Service Level Agreement - is a broader agreement between a service provider and a service consumer. Typically, multiple SLOs make up an SLA. For example, a 99.99% available payment system could be an SLA broken down into specific SLOs for each supporting system.
After defining your SLOs, the next step is to measure these and report on them. Automating monitoring and reporting on SLAs and SLOs is often a complex project that both engineering teams and business units tend to deprioritize. Engineering teams may be less interested because they already have various levels of monitoring to detect failures in real time. Business units, on the other hand, prefer to focus on delivering functionality rather than investing in a complex project that has no immediate business impact.
This brings us to the next topic: sooner or later, organizations operating large distributed systems will need to dedicate dedicated personnel to the reliability of these systems. Let’s talk about the website reliability engineering team.
SRE as an independent team
Site Reliability Engineering (Site Reliability Engineering) originated at Google, started around 2003, and has now grown into a team of more than 1,500 SRE engineers. As production environment operations become more complex and require more automation, this job can quickly become a full-time job. The time it takes for a company to realize they have engineers working full-time on production automation varies: the more critical and fault-prone these systems are, the earlier this happens.
Fast-growing technology companies often form SRE teams early on and let them develop their own roadmaps. At Uber, the SRE team was founded in 2015 with the mission of managing system complexity over time. Other companies might launch such a team at the same time as they create a dedicated infrastructure team. When a company grows to the point where reliability work across teams takes up a lot of engineers' time, it's time to create a dedicated team for it.
Having an SRE team in place makes it easier for all engineers to maintain the operational aspects of large distributed systems. The SRE team may have standard monitoring and alerting tools. They may buy or build oncall tools and be the goto team for oncall best practices. They may facilitate failure review and build systems to more easily detect, mitigate, and prevent failures. They certainly help with failover drills, often facilitate black box testing, and participate in capacity planning. They drive the selection, customization, or building of standard tools to define and measure SLOs and report on them.
Given that companies have different pain points that they look to SRE to solve, SRE organizations differ between companies. The name of this team will often vary as well: it may be called Operations, Platform Engineering, or Infrastructure. Google has published two must-read books on site reliability that are freely available and are a great way to learn more about SRE.
Reliability as Continuous Investment
When building any product, building the first version is just the beginning. After v1, new features will be added in upcoming iterations. If the product is successful and delivers business results, the work continues.
Distributed systems have a similar life cycle, it's just that they require more investment, not just for new features, but also to keep up with expansion. As the system begins to take on more load, store more data, and have more engineers working on it, it requires constant attention to keep running smoothly. Many people when building a distributed system for the first time think of the system as being like a car: once built, it only requires necessary maintenance every few months. But this comparison is far from reality.
I like to compare the effort of operating a distributed system to running a large organization, such as a hospital. To ensure that the hospital is functioning well, ongoing verification and inspection (monitoring, alarms, black box testing) is required. New staff and equipment are constantly added: for hospitals, this is staff like nurses and doctors and new medical equipment; for distributed systems, it is recruiting new engineers and adding new services. As the number of people and services grows, the old way of doing things becomes inefficient: just as a small rural clinic is different from a large hospital in a metropolitan area. Coming up with more efficient ways becomes a full-time job, and measuring and reporting efficiency becomes important. Just like large hospitals have office staff of a support nature such as finance, human resources, or security, running larger-scale distributed systems also relies on support teams such as infrastructure and SRE.
In order for teams to run reliable distributed systems, organizations need to continue to invest in the operation of these systems and the platforms they are built on.
The above is the detailed content of Uber Practice: Some experiences in operating and maintaining large-scale distributed systems. For more information, please follow other related articles on the PHP Chinese website!
Related articles
See more- What is the main difference between HTTP and HTTPS
- How to use javascript to implement custom event functions
- What are the HTTP response status codes?
- What is the hardware architecture in industrial firewall architecture and technology?
- Emergency response and management technology for network security incidents

