Home >Operation and Maintenance >Nginx >How to use Nginx Plus's online activity monitoring function
How to use Nginx Plus's online activity monitoring function
- WBOYWBOYWBOYWBOYWBOYWBOYWBOYWBOYWBOYWBOYWBOYWBOYWBforward
- 2023-05-27 09:31:341004browse
nginx plus now launches a real-time activity monitoring interface to provide key load and performance monitoring. Through the simple restful json interface, it is easy to connect real-time monitoring statistics (stats to live dashboards) and third-party monitoring tools.

nginx plus ping
Details: Online activity monitoring – json feed
in nginx To enable this status prompt in plus, simply add status processing in the server configuration:
Copy code The code is as follows:
location = /status {
allow 192.168.0.0/16; # permit access from local network
deny all; # deny access from everywhere else
status;
}
If you request /status (or any URI that matches the location group), nginx plus will respond with a json document containing the current activity data:
Basic version, startup duration, and identification information;
Total number of connections and requests;
Requests and corresponding counts for each status area;
Each upstream server Request and response technology, as well as health check and startup time statistics;
Table data of each named cache area.
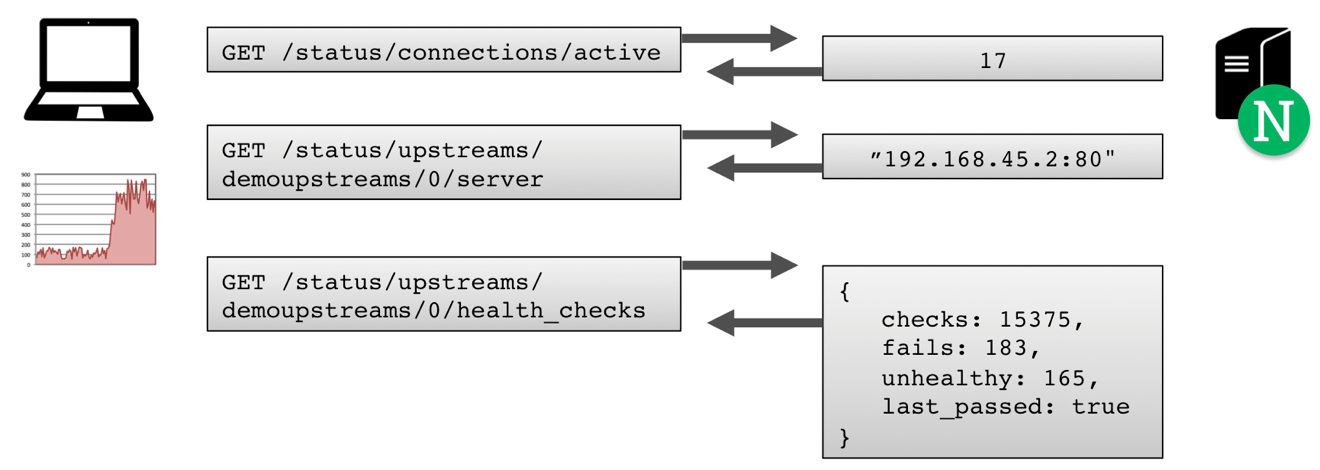
You You can continue to extract subsets of data, or use the restfull method to obtain a single data point:

Details: Life Periodic monitoring – web page
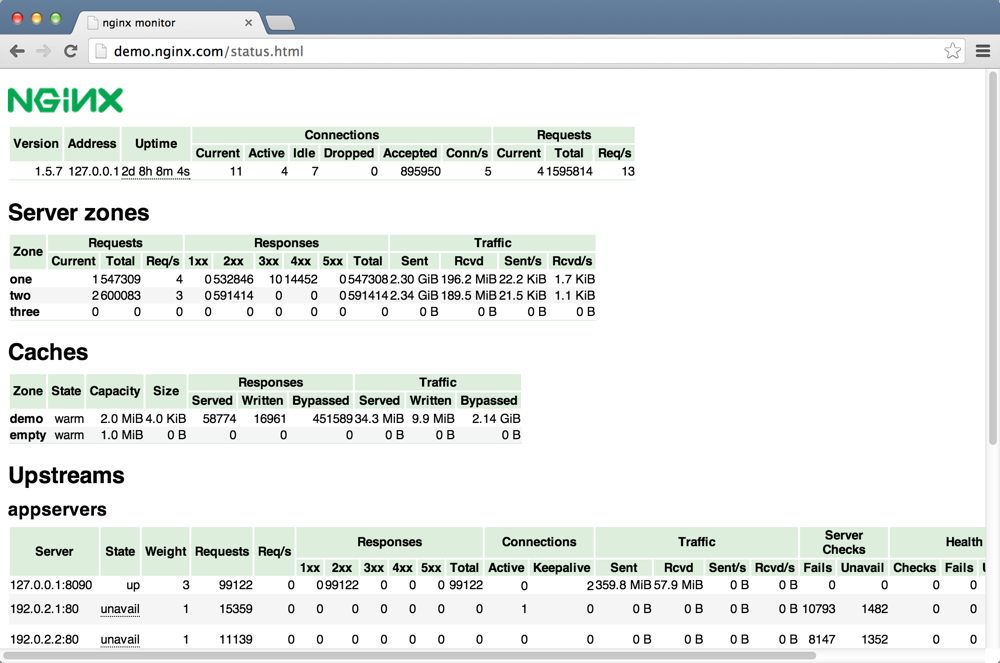
nginx plus comes with a simple web page (/usr/share/nginx/html/status.html) for polling status information and displaying it in a simple table. You can use the following configuration to enable this request http://host:8080/status.html:
Copy code The code is as follows:
server {
listen 8080;
root /usr/share/nginx/html;
location = /status {
status;
}
}
The above is the detailed content of How to use Nginx Plus's online activity monitoring function. For more information, please follow other related articles on the PHP Chinese website!

