

 Technology peripheralsAIStep-by-step visualization of the decision-making process of the gradient boosting algorithm
Step-by-step visualization of the decision-making process of the gradient boosting algorithm

The gradient boosting algorithm is one of the most commonly used ensemble machine learning techniques. This model uses a sequence of weak decision trees to build a strong learner. This is also the theoretical basis of the XGBoost and LightGBM models, so in this article, we will build a gradient boosting model from scratch and visualize it.
Introduction to Gradient Boosting Algorithm
Gradient Boosting algorithm (Gradient Boosting) is an ensemble learning algorithm that improves performance by building multiple weak classifiers and then combining them into a strong classifier. The prediction accuracy of the model.
The principle of gradient boosting algorithm can be divided into the following steps:
- Initialize the model: Generally speaking, we can use a simple model (such as a decision tree) as the initial classifier.
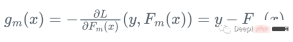
- Calculate the negative gradient of the loss function: Calculate the negative gradient of the loss function for each sample point under the current model. This is equivalent to asking the new classifier to fit the error under the current model.
- Train a new classifier: Use these negative gradients as target variables to train a new weak classifier. This weak classifier can be any classifier, such as decision tree, linear model, etc.
- Update model: Add new classifiers to the original model, and combine them using weighted average or other methods.
- Repeat iteration: Repeat the above steps until the preset number of iterations is reached or the preset accuracy is reached.
Since the gradient boosting algorithm is a serial algorithm, its training speed may be slower. Let’s introduce it with a practical example:
Assume we have a feature Set Xi and value Yi, to calculate the best estimate of y

We start with the mean of y


import numpy as np
 import sklearn.datasets as ds
 import pandas as pd
 import matplotlib.pyplot as plt
 import matplotlib as mpl

 from sklearn import tree
 from itertools import product,islice
 import seaborn as snsmoonDS = ds.make_moons(200, noise = 0.15, random_state=16)
 moon = moonDS[0]
 color = -1*(moonDS[1]*2-1)

 df =pd.DataFrame(moon, columns = ['x','y'])
 df['z'] = color
 df['f0'] =df.y.mean()
 df['r0'] = df['z'] - df['f0']
 df.head(10)
Let’s visualize the data:
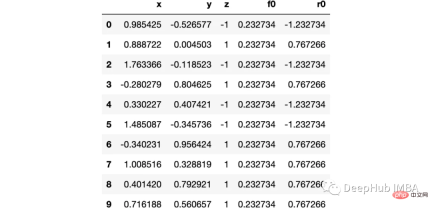
下图可以看到,该数据集是可以明显的区分出分类的边界的,但是因为他是非线性的,所以使用线性算法进行分类时会遇到很大的困难。

那么我们先编写一个简单的梯度增强模型:
def makeiteration(i:int):
"""Takes the dataframe ith f_i and r_i and approximated r_i from the features, then computes f_i+1 and r_i+1"""
clf = tree.DecisionTreeRegressor(max_depth=1)
clf.fit(X=df[['x','y']].values, y = df[f'r{i-1}'])
df[f'r{i-1}hat'] = clf.predict(df[['x','y']].values)

eta = 0.9
df[f'f{i}'] = df[f'f{i-1}'] + eta*df[f'r{i-1}hat']
df[f'r{i}'] = df['z'] - df[f'f{i}']
rmse = (df[f'r{i}']**2).sum()
clfs.append(clf)
rmses.append(rmse)
上面代码执行3个简单步骤:
将决策树与残差进行拟合:
clf.fit(X=df[['x','y']].values, y = df[f'r{i-1}'])
 df[f'r{i-1}hat'] = clf.predict(df[['x','y']].values)
然后,我们将这个近似的梯度与之前的学习器相加:
df[f'f{i}'] = df[f'f{i-1}'] + eta*df[f'r{i-1}hat']最后重新计算残差:
df[f'r{i}'] = df['z'] - df[f'f{i}']步骤就是这样简单,下面我们来一步一步执行这个过程。
第1次决策

Tree Split for 0 and level 1.563690960407257

第2次决策

Tree Split for 1 and level 0.5143677890300751

第3次决策

Tree Split for 0 and level -0.6523728966712952

第4次决策

Tree Split for 0 and level 0.3370491564273834

第5次决策

Tree Split for 0 and level 0.3370491564273834

第6次决策

Tree Split for 1 and level 0.022058885544538498

第7次决策

Tree Split for 0 and level -0.3030575215816498

第8次决策

Tree Split for 0 and level 0.6119407713413239

第9次决策

可以看到通过9次的计算,基本上已经把上面的分类进行了区分

我们这里的学习器都是非常简单的决策树,只沿着一个特征分裂!但整体模型在每次决策后边的越来越复杂,并且整体误差逐渐减小。
plt.plot(rmses)

这也就是上图中我们看到的能够正确区分出了大部分的分类
如果你感兴趣可以使用下面代码自行实验:
https://www.php.cn/link/bfc89c3ee67d881255f8b097c4ed2d67
The above is the detailed content of Step-by-step visualization of the decision-making process of the gradient boosting algorithm. For more information, please follow other related articles on the PHP Chinese website!

 An easy-to-understand explanation of how to set up two-step authentication in ChatGPT!May 12, 2025 pm 05:37 PM
ChatGPT Security Enhanced: Two-Stage Authentication (2FA) Configuration Guide Two-factor authentication (2FA) is required as a security measure for online platforms. This article will explain in an easy-to-understand manner the 2FA setup procedure and its importance in ChatGPT. This is a guide for those who want to use ChatGPT safely. Click here for OpenAI's latest AI agent, OpenAI Deep Research ⬇️ [ChatGPT] What is OpenAI Deep Research? A thorough explanation of how to use it and the fee structure! table of contents ChatG
![[For businesses] ChatGPT training | A thorough introduction to 8 free training options, subsidies, and examples!](https://img.php.cn/upload/article/001/242/473/174704251871181.jpg?x-oss-process=image/resize,p_40) [For businesses] ChatGPT training | A thorough introduction to 8 free training options, subsidies, and examples!May 12, 2025 pm 05:35 PM
[For businesses] ChatGPT training | A thorough introduction to 8 free training options, subsidies, and examples!May 12, 2025 pm 05:35 PMThe use of generated AI is attracting attention as the key to improving business efficiency and creating new businesses. In particular, OpenAI's ChatGPT has been adopted by many companies due to its versatility and accuracy. However, the shortage of personnel who can effectively utilize ChatGPT is a major challenge in implementing it. In this article, we will explain the necessity and effectiveness of "ChatGPT training" to ensure successful use of ChatGPT in companies. We will introduce a wide range of topics, from the basics of ChatGPT to business use, specific training programs, and how to choose them. ChatGPT training improves employee skills
 A thorough explanation of how to use ChatGPT to streamline your Twitter operations!May 12, 2025 pm 05:34 PM
Improved efficiency and quality in social media operations are essential. Particularly on platforms where real-time is important, such as Twitter, requires continuous delivery of timely and engaging content. In this article, we will explain how to operate Twitter using ChatGPT from OpenAI, an AI with advanced natural language processing capabilities. By using ChatGPT, you can not only improve your real-time response capabilities and improve the efficiency of content creation, but you can also develop marketing strategies that are in line with trends. Furthermore, precautions for use
![[For Mac] Explaining how to get started and how to use the ChatGPT desktop app!](https://img.php.cn/upload/article/001/242/473/174704239752855.jpg?x-oss-process=image/resize,p_40) [For Mac] Explaining how to get started and how to use the ChatGPT desktop app!May 12, 2025 pm 05:33 PM
[For Mac] Explaining how to get started and how to use the ChatGPT desktop app!May 12, 2025 pm 05:33 PMChatGPT Mac desktop app thorough guide: from installation to audio functions Finally, ChatGPT's desktop app for Mac is now available! In this article, we will thoroughly explain everything from installation methods to useful features and future update information. Use the functions unique to desktop apps, such as shortcut keys, image recognition, and voice modes, to dramatically improve your business efficiency! Installing the ChatGPT Mac version of the desktop app Access from a browser: First, access ChatGPT in your browser.
 What is the character limit for ChatGPT? Explanation of how to avoid it and upper limits by modelMay 12, 2025 pm 05:32 PM
When using ChatGPT, have you ever had experiences such as, "The output stopped halfway through" or "Even though I specified the number of characters, it didn't output properly"? This model is very groundbreaking and not only allows for natural conversations, but also allows for email creation, summary papers, and even generate creative sentences such as novels. However, one of the weaknesses of ChatGPT is that if the text is too long, input and output will not work properly. OpenAI's latest AI agent, "OpenAI Deep Research"
 What is ChatGPT's voice input and voice conversation function? Explaining how to set it up and how to use itMay 12, 2025 pm 05:27 PM
ChatGPT is an innovative AI chatbot developed by OpenAI. It not only has text input, but also features voice input and voice conversation functions, allowing for more natural communication. In this article, we will explain how to set up and use the voice input and voice conversation functions of ChatGPT. Even when you can't take your hands off, ChatGPT responds and responds with audio just by talking to you, which brings great benefits in a variety of situations, such as busy business situations and English conversation practice. A detailed explanation of how to set up the smartphone app and PC, as well as how to use each.
 An easy-to-understand explanation of how to use ChatGPT for job hunting and job hunting!May 12, 2025 pm 05:26 PM
The shortcut to success! Effective job change strategies using ChatGPT In today's intensifying job change market, effective information gathering and thorough preparation are key to success. Advanced language models like ChatGPT are powerful weapons for job seekers. In this article, we will explain how to effectively utilize ChatGPT to improve your job hunting efficiency, from self-analysis to application documents and interview preparation. Save time and learn techniques to showcase your strengths to the fullest, and help you make your job search a success. table of contents Examples of job hunting using ChatGPT Efficiency in self-analysis: Chat
 An easy-to-understand explanation of how to create and output mind maps using ChatGPT!May 12, 2025 pm 05:22 PM
Mind maps are useful tools for organizing information and coming up with ideas, but creating them can take time. Using ChatGPT can greatly streamline this process. This article will explain in detail how to easily create mind maps using ChatGPT. Furthermore, through actual examples of creation, we will introduce how to use mind maps on various themes. Learn how to effectively organize and visualize your ideas and information using ChatGPT. OpenAI's latest AI agent, OpenA


Hot AI Tools

Undresser.AI Undress
AI-powered app for creating realistic nude photos

AI Clothes Remover
Online AI tool for removing clothes from photos.

Undress AI Tool
Undress images for free

Clothoff.io
AI clothes remover

Video Face Swap
Swap faces in any video effortlessly with our completely free AI face swap tool!

Hot Article
Hot Tools

SecLists
SecLists is the ultimate security tester's companion. It is a collection of various types of lists that are frequently used during security assessments, all in one place. SecLists helps make security testing more efficient and productive by conveniently providing all the lists a security tester might need. List types include usernames, passwords, URLs, fuzzing payloads, sensitive data patterns, web shells, and more. The tester can simply pull this repository onto a new test machine and he will have access to every type of list he needs.

ZendStudio 13.5.1 Mac
Powerful PHP integrated development environment

MantisBT
Mantis is an easy-to-deploy web-based defect tracking tool designed to aid in product defect tracking. It requires PHP, MySQL and a web server. Check out our demo and hosting services.

MinGW - Minimalist GNU for Windows
This project is in the process of being migrated to osdn.net/projects/mingw, you can continue to follow us there. MinGW: A native Windows port of the GNU Compiler Collection (GCC), freely distributable import libraries and header files for building native Windows applications; includes extensions to the MSVC runtime to support C99 functionality. All MinGW software can run on 64-bit Windows platforms.

SublimeText3 Linux new version
SublimeText3 Linux latest version

