

 Backend DevelopmentPython TutorialDon't know how to make charts? Ten Python data visualization libraries to help you!
Don't know how to make charts? Ten Python data visualization libraries to help you!


1. matplotlib

Two histograms
matplotlib is the leader of Python visualization libraries. After more than ten years, it is still the most commonly used drawing library for Python users. Its design is very close to MATLAB, a commercial programming language designed in the 1980s.
Since matplotlib is the first Python visualization library, there are many other libraries built on it or calling it directly.
For example, pandas and Seaborn are outsourcing of matplotlib. They allow you to call matplotlib methods with less code.
Although matplotlib can be used to easily obtain general information about the data, it is not so easy to quickly and easily create charts for publication.
As Chris Moffitt mentioned in "Introduction to Python Visualization Tools": "It is very powerful and very complex."
matplotlib has a strong default function of the 1990s. The style of the pictures has also been complained about for many years. The upcoming release of matplotlib 2.0 is said to include many more fashionable styles.
Developer: John D. Hunter
More information:https://www.php.cn/link/a563b6d5abbf137175059d6bb14672cc
2. Seaborn
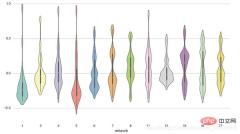
Violinplot (Michael Waskom)
Seaborn uses matplotlib to create beautiful charts with simple code.
The biggest difference between Seaborn and matplotlib is that its default drawing style and color matching have a modern aesthetic.
Since Seaborn is built on matplotlib, you need to understand matplotlib to adjust Seaborn's default parameters.
Developer: Michael Waskom
More information:https://www.php.cn/link/b93f11867481fc6d77908aea58ba6198
3. ggplot

Small multiples (ŷhat)
ggplot is a plotting package based on R, ggplot2, and also uses the source of "Image Grammar" ( Concepts in The Grammar of Graphics.
The difference between ggplot and matplotlib is that it allows you to overlay different layers to complete a picture. For example you can start with the axis, then add points, add lines, trend lines, etc.
Although "Image Grammar" has been praised as a drawing method that is "close to the thinking process", users who are accustomed to matplotlib may need some time to adapt to this new way of thinking.
The author of ggplot mentioned that ggplot is not suitable for making very personalized images. It sacrifices image complexity for operational simplicity.
ggplot is tightly integrated with pandas, so it's best to store your data in a DataFrame when using ggplot.
ggplot is tightly integrated with pandas, so when you use it, It's better to read your data into a DataFrame.
Developer: ŷhat
More information:https://www.php.cn/link/be23c41621390a448779ee72409e5f49
4. Bokeh

Interactive weather statistics for three cities (Continuum Analytics)
Like ggplot, Bokeh is also based on the concept of "Graphic Grammar".
But unlike ggplot, it is completely based on Python and not referenced from R.
Its advantage is that it can be used to create interactive charts that can be used directly on the network. Charts can be output as JSON objects, HTML documents or interactive web applications.
Boken also supports data streaming and real-time data. Bokeh offers three levels of control for different users.
The highest level of control is used for quick graphing, mainly for making common images, such as histograms, box plots, and histograms.
The medium level of control allows you to control basic elements of the image (such as points in a distribution plot) just like matplotlib.
The lowest level of control is primarily intended for developers and software engineers.
It has no default value, you have to define each element of the chart.
Developer: Continuum Analytics
More information:https://www.php.cn/link/fdad3b5b2200b598dfde9517e5b426a8
5, pygal

Box plot (Florian Mounier)
pygal, like Bokeh and Plotly, provides interactive graphics that can be embedded directly into the web browser.
The main difference from the other two is that it can output charts into SVG format.
If your data size is relatively small, SVG is enough. But if you have hundreds or thousands of data points, the SVG rendering process will become very slow.
Since all charts are encapsulated into methods, and the default style is also very beautiful, you can easily create beautiful charts with a few lines of code.
Developer: Florian Mounier
More information:https://www.php.cn/link/bf5d232e6c54a84b97769a91adb1642f
6. Plotly
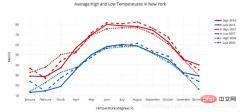
Line plot (Plotly)
You may have heard of the online graphing tool Plotly, but did you know you can use it through Python? ?
Plotly is dedicated to the production of interactive charts like Bokeh, but it provides several chart types that are difficult to find in other libraries, such as contour plots, tree plots, and three-dimensional charts.
Developer: Plotly
More information:https://www.php.cn/link/d01c25576ff1c53de58e0e6970a2d510
7. geoplotlib
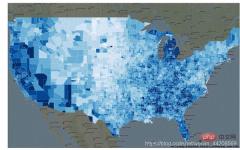
Choropleth (Andrea Cuttone)
geoplotlib is a toolbox for producing maps and geographically related data.
You can use it to create a variety of maps, such as contour maps, heat maps, and point density maps.
You must install Pyglet (an object-oriented programming interface) to use geoplotlib. However, since most Python visualization tools do not provide maps, it is quite convenient to have a tool dedicated to drawing maps.
Developer: Andrea Cuttone
More information:https://www.php.cn/link/a9cf46a38a9b05e959f33215e5cdc38a
8, Gleam
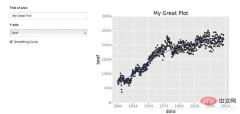
Scatter plot with trend line (David Robinson)
Gleam borrows the inspiration of Shiny in R. It allows you to turn your analysis into an interactive web application using only Python programs. You don't need to know HTML CSS or JavaScript.
Gleam can use any Python visualization library.
When you create a chart, you can add a field to it so users can use it to sort and filter the data.
Developer: David Robinson
More information:https://www.php.cn/link/c0ad6deb373037e7f63f219c850e3396
9. missingno

Nullity matrix (Aleksey Bilogur)
Missing data is forever painful.
missingno uses images to quickly assess the situation of missing data, instead of wading through the data table.
You can sort or filter the data based on its completeness, or consider correcting the data based on the heat map or tree map.
Developer: Aleksey Bilogur
More information:https://www.php.cn/link/bc05ca60f2f0d67d0525f41d1d8f8717
10、Leather

The best definition of Leather comes from its author Christopher Groskopf.
"Leather is for people who need a chart now and don't care if the chart is perfect."
It can be used with all data types and generates SVG images, so that when you adjust Image size is increased without losing image quality.
The above is the detailed content of Don't know how to make charts? Ten Python data visualization libraries to help you!. For more information, please follow other related articles on the PHP Chinese website!

 Python vs. C : Understanding the Key DifferencesApr 21, 2025 am 12:18 AM
Python and C each have their own advantages, and the choice should be based on project requirements. 1) Python is suitable for rapid development and data processing due to its concise syntax and dynamic typing. 2)C is suitable for high performance and system programming due to its static typing and manual memory management.
 Python vs. C : Which Language to Choose for Your Project?Apr 21, 2025 am 12:17 AM
Choosing Python or C depends on project requirements: 1) If you need rapid development, data processing and prototype design, choose Python; 2) If you need high performance, low latency and close hardware control, choose C.
 Reaching Your Python Goals: The Power of 2 Hours DailyApr 20, 2025 am 12:21 AM
By investing 2 hours of Python learning every day, you can effectively improve your programming skills. 1. Learn new knowledge: read documents or watch tutorials. 2. Practice: Write code and complete exercises. 3. Review: Consolidate the content you have learned. 4. Project practice: Apply what you have learned in actual projects. Such a structured learning plan can help you systematically master Python and achieve career goals.
 Maximizing 2 Hours: Effective Python Learning StrategiesApr 20, 2025 am 12:20 AM
Methods to learn Python efficiently within two hours include: 1. Review the basic knowledge and ensure that you are familiar with Python installation and basic syntax; 2. Understand the core concepts of Python, such as variables, lists, functions, etc.; 3. Master basic and advanced usage by using examples; 4. Learn common errors and debugging techniques; 5. Apply performance optimization and best practices, such as using list comprehensions and following the PEP8 style guide.
 Choosing Between Python and C : The Right Language for YouApr 20, 2025 am 12:20 AM
Python is suitable for beginners and data science, and C is suitable for system programming and game development. 1. Python is simple and easy to use, suitable for data science and web development. 2.C provides high performance and control, suitable for game development and system programming. The choice should be based on project needs and personal interests.
 Python vs. C : A Comparative Analysis of Programming LanguagesApr 20, 2025 am 12:14 AM
Python is more suitable for data science and rapid development, while C is more suitable for high performance and system programming. 1. Python syntax is concise and easy to learn, suitable for data processing and scientific computing. 2.C has complex syntax but excellent performance and is often used in game development and system programming.
 2 Hours a Day: The Potential of Python LearningApr 20, 2025 am 12:14 AM
It is feasible to invest two hours a day to learn Python. 1. Learn new knowledge: Learn new concepts in one hour, such as lists and dictionaries. 2. Practice and exercises: Use one hour to perform programming exercises, such as writing small programs. Through reasonable planning and perseverance, you can master the core concepts of Python in a short time.
 Python vs. C : Learning Curves and Ease of UseApr 19, 2025 am 12:20 AM
Python is easier to learn and use, while C is more powerful but complex. 1. Python syntax is concise and suitable for beginners. Dynamic typing and automatic memory management make it easy to use, but may cause runtime errors. 2.C provides low-level control and advanced features, suitable for high-performance applications, but has a high learning threshold and requires manual memory and type safety management.


Hot AI Tools

Undresser.AI Undress
AI-powered app for creating realistic nude photos

AI Clothes Remover
Online AI tool for removing clothes from photos.

Undress AI Tool
Undress images for free

Clothoff.io
AI clothes remover

Video Face Swap
Swap faces in any video effortlessly with our completely free AI face swap tool!

Hot Article
Hot Tools

MantisBT
Mantis is an easy-to-deploy web-based defect tracking tool designed to aid in product defect tracking. It requires PHP, MySQL and a web server. Check out our demo and hosting services.

Dreamweaver Mac version
Visual web development tools

SublimeText3 Mac version
God-level code editing software (SublimeText3)

PhpStorm Mac version
The latest (2018.2.1) professional PHP integrated development tool

WebStorm Mac version
Useful JavaScript development tools

