
Home >Backend Development >Python Tutorial >Ten Python tips cover 90% of data analysis needs!
Ten Python tips cover 90% of data analysis needs!

- 王林forward
- 2023-04-12 08:04:021137browse
The daily work of data analysts involves various tasks, such as data preprocessing, data analysis, machine learning model creation, and model deployment.
In this article, I will share 10 Python operations that can cover 90% of data analysis problems. Gain some likes, favorites, and attention.
1. Reading data sets
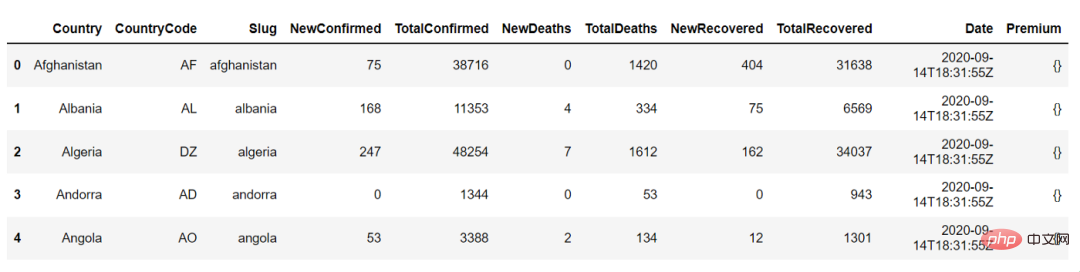
Reading data is an integral part of data analysis. Understanding how to read data from different file formats is the first step for a data analyst. Here is an example of how to use pandas to read a csv file containing Covid-19 data.
import pandas as pd
# reading the countries_data file along with the location within read_csv function.
countries_df = pd.read_csv('C:/Users/anmol/Desktop/Courses/Python for Data Science/Code/countries_data.csv')
# showing the first 5 rows of the dataframe
countries_df.head()
The following is the output of countries_df.head(), we can use it to view the first 5 rows of the data frame:
2. Summary statistics
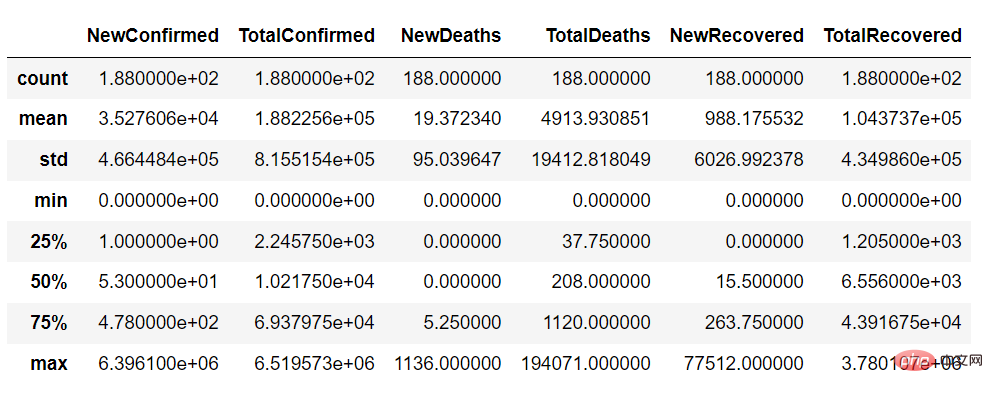
The next step is to understand the data by looking at the data summary, such as the count of numeric columns such as NewConfirmed and TotalConfirmed, the mean, standard deviation, quantile, and the frequency and highest occurrence value of categorical columns such as country code
<span style="color: rgb(89, 89, 89); margin: 0px; padding: 0px; background: none 0% 0% / auto repeat scroll padding-box border-box rgba(0, 0, 0, 0);">countries_df</span>.<span style="color: rgb(0, 92, 197); margin: 0px; padding: 0px; background: none 0% 0% / auto repeat scroll padding-box border-box rgba(0, 0, 0, 0);">describe</span>()
Using the describe function, we can get a summary of the continuous variables of the data set, as follows:
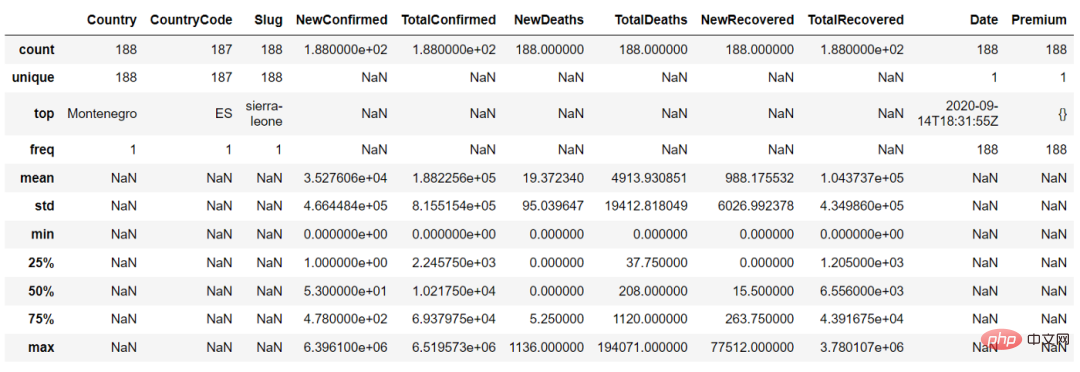
In the describe() function, we can set the parameter "include = ' all'" to obtain the summary of continuous variables and categorical variables
countries_df.describe(include = 'all')
3. Data selection and filtering
Analysis does not actually require all rows and sums of the data set Columns, just select the columns of interest and filter some rows based on the question.
For example, we can use the following code to select the Country and NewConfirmed columns:
countries_df[['Country','NewConfirmed']]
We can also filter the data Country, using loc, we can filter the column based on some values, as shown below:
countries_df.loc[countries_df['Country'] == 'United States of America']

4. Aggregation
Data aggregation such as count, sum, mean, etc. is one of the most commonly performed tasks in data analysis.
We can use aggregation to find the total number of NewConfimed cases by country. Use the groupby and agg functions to perform aggregation.
countries_df.groupby(['Country']).agg({'NewConfirmed':'sum'})5, Join
Use the Join operation to combine 2 data sets into one data set.
For example: One dataset may contain the number of Covid-19 cases in different countries, and another dataset may contain latitude and longitude information for different countries.
Now we need to combine these two information, then we can perform the connection operation as shown below
countries_lat_lon = pd.read_excel('C:/Users/anmol/Desktop/Courses/Python for Data Science/Code/countries_lat_lon.xlsx')

# joining the 2 dataframe : countries_df and countries_lat_lon
# syntax : pd.merge(left_df, right_df, on = 'on_column', how = 'type_of_join')
joined_df = pd.merge(countries_df, countries_lat_lon, on = 'CountryCode', how = 'inner')
joined_df
6. Built-in functions
Understand the mathematical built-in functions, such as min(), max(), mean(), sum(), etc., are very helpful in performing different analyses.
We can apply these functions directly on the data frame by calling them. These functions can be used independently on columns or in aggregate functions, as shown below:
# finding sum of NewConfirmed cases of all the countries
countries_df['NewConfirmed'].sum()
# Output : 6,631,899

# finding the sum of NewConfirmed cases across different countries
countries_df.groupby(['Country']).agg({'NewConfirmed':'sum'})

# Output
#NewConfirmed
#Country
#Afghanistan75
#Albania 168
#Algeria 247
#Andorra0
#Angola53
7. User-defined Function
The functions we write ourselves are user-defined functions. We can execute the code in these functions by calling the function when needed. For example, we can create a function to add 2 numbers as follows:
# User defined function is created using 'def' keyword, followed by function definition - 'addition()'
# and 2 arguments num1 and num2
def addition(num1, num2):
return num1+num2

# calling the function using function name and providing the arguments
print(addition(1,2))
#output : 3
8, Pivot
Pivot is to convert the unique values within a column row into multiple new columns, which is Great data processing techniques.
Using the pivot_table() function on the Covid-19 dataset, we can convert the country names into separate new columns:
# using pivot_table to convert values within the Country column into individual columns and
# filling the values corresponding to these columns with numeric variable - NewConfimed
pivot_df = pd.pivot_table(countries_df,columns = 'Country', values = 'NewConfirmed')
pivot_df
9. Iterate over the data frame
Many When we need to traverse the indexes and rows of the data frame, we can use the iterrows function to traverse the data frame:
# iterating over the index and row of a dataframe using iterrows() function
for index, row in countries_df.iterrows():
print('Index is ' + str(index))
print('Country is '+ str(row['Country']))

# Output :
# Index is 0
# Country is Afghanistan
# Index is 1
# Country is Albania
# .......
10. String operations
Many times we process string columns in the data set, here In this case, it's important to understand some basic string operations.
For example, how to convert a string to uppercase, lowercase and how to find the length of the string.
# country column to upper case
countries_df['Country_upper'] = countries_df['Country'].str.upper()

# country column to lower case
countries_df['CountryCode_lower']=countries_df['CountryCode'].str.lower()

# finding length of characters in the country column
countries_df['len'] = countries_df['Country'].str.len()

countries_df.head()
The above is the detailed content of Ten Python tips cover 90% of data analysis needs!. For more information, please follow other related articles on the PHP Chinese website!