

 Technology peripheralsAIGlobal positioning technology based on feature points in autonomous driving using Wanzi analysis
Global positioning technology based on feature points in autonomous driving using Wanzi analysis

In driverless driving, perception, positioning, planning and decision-making, and control are the four basic system modules. Since the current algorithm cannot achieve absolute intelligence, a large amount of prior knowledge is still needed to improve module performance and robustness to achieve safe autonomous driving. Among them, high-precision maps are the integration of prior knowledge of roads and surrounding environments. The accurate positioning based on the map is an important basis for judging driving conditions and provides strong support for subsequent perception and planning decisions.
The main data sources used for positioning currently include GPS, lidar, vision, and millimeter wave radar. For vision, although there is currently no sufficiently reliable positioning solution recognized in the industry, exploration in this area has never stopped. The main reasons are as follows:
Safety is The most important indicator of the autonomous driving system, so the implementation of most functions, is the coupling of multi-source data and different algorithm results. No sensor solution is perfect. For example, GPS RTK, as a widely used solution, is easily affected by satellite conditions, weather conditions, and data link transmission conditions, and cannot be used in tunnels, indoors, and densely populated areas with high-rise buildings. Furthermore, although lidar has the advantages of small computational workload, providing depth information, and is not affected by illumination, the information is sparse, the cost is still very expensive, and it does not yet have the ability to assemble large quantities of vehicles. In comparison, although the visual information provided by cameras is affected by lighting and weather, it is low-cost and rich in content. It is the main data source for current assisted driving solutions and also has great potential in map positioning.
Since the core ideas of mainstream visual positioning algorithms are the same, this article only introduces the most commonly used global positioning based on feature points in practice from the perspective of a series of important algorithm framework components. Algorithm, that is, positioning in the map coordinate system. This article omits the optimization and geometric constraint formula derivation involved, aiming to give students a macro introduction to positioning algorithms. For specific details, please refer to relevant literature and books.
Global positioning algorithm based on feature points
Visual global positioning refers to finding the position of the camera in the map coordinate system based on the current image 6 degrees of freedom (DoF) pose (Pose), namely (x, y, z) coordinates, and angular deflections around three coordinate axes (yaw, pitch, roll). At present, it can be mainly classified into 3D structure-based methods, 2D image-based methods, sequence image-based methods, and deep learning-based methods. Among them, methods based on deep learning are end-to-end methods, while other multi-stage (Multi-stage) non-end-to-end methods have different processes, but the algorithm ideas are mostly as shown in Fig. 1 Shown:

Figure 1: Based on the query image, calculate the 2D-3D transformation matrix and solve the camera pose
Based on the built map, match the most similar map subset (image/point cloud/feature point) in history, and based on the historical pose true value provided by the matched map subset, The true value of the feature point coordinates, calculate the transformation matrix between point pairs, and solve the current camera pose.
So, its core includes four aspects: image description, mapping query, feature matching, and pose calculation. This is only a macro classification at the technical level. The actual algorithm framework may not necessarily be executed in this order, and scholars mainly focus on improving these technologies in their research. Overall, image description based on feature points is basically mature and has less development. Since pose calculation is an optimization problem based on geometric constraints, the method is relatively fixed. In contrast, there are many improved techniques in mapping queries and feature matching. Depending on the data source, mapping query and matching can be 2D-2D, 2D-3D, or 3D-3D. 2D images are obtained by cameras, and 3D point clouds can be generated by binocular cameras or RGB-D cameras that provide depth.
Feature point extraction
The 2D image itself is a matrix composed of brightness and color. It is very sensitive to viewing angle, illumination, hue changes, etc., and it is very difficult to use it directly. Therefore, representative points are generally used for relevant calculations. People hope that such points have the advantages of rotation, translation, scale, illumination invariance, etc. These points are called feature points of the image, including key-points and descriptors. Key points express the location of feature points, while descriptors describe the visual characteristics of feature points, mostly in vector form. Generally speaking, descriptors mainly count grayscale/color gradient changes around key points in a certain pattern. For a robust descriptor, the distance (Distance) of the descriptor of the same feature point should be smaller in different situations in different images.
Descriptors are generally hand-crafted features. Classic descriptions include HOG (Histogram of oriented gradients) [1], SIFT (Scale-invariant feature transform) [2], SURF (Speeded up robust features) [3], AKAZE (Accelerated KAZE) [4], etc.
In order to meet the real-time requirements, some binary pattern descriptors with faster calculation speed have been designed, such as LBP (Local binary patterns) [5], BRIEF (Binary robust independent elementary features), ORB (Oriented FAST and rotated BRIEF) [6], BRISK (Binary robust invariant scalable key-point) [7], FREAK (Fast retina key-point) [8], etc.
Before deep learning became popular, these hand-crafted features had been leading the entire computational vision industry. To this day, these features are still widely used in scenarios that lack labeled data and have many constraints. application. The following is a brief introduction to two commonly used descriptors.
SIFT
SIFT descriptor can be regarded as one of the most influential technologies in the CV world. From the perspective of key point detection, the Difference of Gaussian (DoG) method is mainly used to detect extreme points on multi-scale space as key points. Babaud et al. [9] proved that Gaussian smoothing is the only multi-scale spatial smoothing filter kernel that can be used, providing sufficient theoretical support for related methods.
So why can such a method find key feature points?
Because the Gaussian kernel can scale the image to different scales through blurring space, while the smooth area with small gradient changes has smaller value differences in different scale spaces. On the contrary, the differences are larger in areas such as edges, points, corners, and textures. In this way, by making differences between images of adjacent scales, the extreme points of the multi-scale space can finally be calculated. However, different image details are inherently at different scales. For example, in a portrait, the face may be smoothed into one piece after a small blur, while the corners of the frame may require larger-scale smoothing to reflect local "extreme values".
Therefore, as shown in Fig. 2, the images are first grouped (Octave) using the image pyramid, and then Gaussian kernels of different scales are used in each group to form a series of layers. This method is better than simply using more scales of Gaussian kernels and can detect more feature points. It should be noted that although SIFT uses DoG for key point detection, other detection methods are also feasible and do not affect the establishment of SIFT descriptors.

Figure 2: Difference of Gaussian method
Description of SIFT feature points sub, can be understood as a simple statistical version of HOG. As shown in Fig. 3, with the detected key point as the center, a surrounding 16 × 16 area is selected, and the area is reorganized into four 4 × 4 patches. For each block, an 8-bin histogram is used to count the gradient. The direction of the gradient determines which bin it falls into, and the module of the gradient determines the size of the value. In order to ensure scale consistency, the gradient size needs to be normalized. In order to ensure rotation invariance, a main direction is calculated based on all gradients in the 16 × 16 area, and all gradients are rotated according to the main direction. The result is a 4 × 4 × 8 128-dimensional vector.

Figure 3: SIFT descriptor based on gradient block statistics
Binary descriptor
Although after SIFT was proposed, some improved algorithms such as SURF, AKAZE, etc. were produced, but even today in 2019, it is still difficult to guarantee the real-time requirements of the algorithm in some scenarios. For example, handheld devices generally have limited computing power. In autonomous driving, CPU and GPU resources need to be scheduled simultaneously by multiple computing-intensive modules. Therefore, efficiency is an important indicator to examine the practicality of an algorithm.
In order to improve efficiency, some binary descriptors have been proposed by scholars. Generally, these methods perform point sampling around feature key points. Then the grayscale size of a pair of points is compared, and the result is expressed as 0/1, forming an N-dimensional binary description vector, forming a binary pattern of feature points. The biggest difference between different binary descriptors mainly lies in the different feature sampling modes and different point pair selection methods.

Figure 4: LBP description subsampling mode
As shown in Fig. As shown in 4, the LBP descriptor adopts a scheme of circular sampling around the key point and comparing it with the grayscale of the central key point. The grayscale comparison results are displayed on the ring, with black points being 0 and white points being 1. LBP is the simplest form of binary descriptor, while ORB improves the BRIEF feature and is a commonly used binary descriptor at present. As shown in Fig. 5, when selecting point pairs, ORB uses a random method to describe local details more comprehensively, unlike simply using the center point. However, the correlation between point pairs will be relatively large, thus reducing the discriminativeness of the descriptor. ORB directly uses greedy and exhaustive methods to solve this problem and find random point pairs with low correlation.

##Figure 5: ORB descriptor point pair selection mode
Above The sampling method and point pair selection method of binary descriptors are in line with people's general intuition, while descriptors such as BRISK and FREAK provide a more regular binary pattern construction method with scale information. For example, the FREAK descriptor mimics the visual sampling pattern of the human eye. As shown in Fig. 6, the value of each sampling point is the mean gray value within the red circle, and the blue line represents the point pair selection plan.

##Figure 6: FREAK describes subsampling, point pair selection mode
The high efficiency of binary descriptors is mainly reflected in three aspects.(1) Binary descriptors use binary vectors as feature descriptions, and only need to compare the size of point pairs without calculating specific gradients.
(2) The Hamming distance (Hamming distance), which is faster to calculate and easier to optimize, can be used to compare two descriptors.
(3) Since each binary vector corresponds to a decimal number, it itself also represents a pattern and does not need to be represented by a histogram like SIFT.
Binary descriptors are generally not as discriminative as SIFT family descriptors, but in specific scenarios, combined with parallel programming, the efficiency can be dozens of times higher while ensuring similar discriminative capabilities. Even a hundred times.
Database creation and query
The database can be understood as the integration of the map index. Maps can be composed of pure 2D images, 3D point cloud maps, or a combination of 2D images and 3D point clouds. 3D point cloud map generation mainly uses the three-dimensional reconstruction method SfM (Structure from motion) to infer 3D information from time series 2D images. If a binocular, RGB-D camera provides depth, more accurate 3D point information can be obtained. It also includes some selection strategies such as key-frame. The specific methods are beyond the scope of this article. Interested students can check the relevant information by themselves. The role of the database is:
For an input observation image, query the mapping history (image/point cloud/feature point) through the database to obtain the most likely observation of the current image. Map subset (image/point cloud/feature point), match the map with observation information, calculate the transformation matrix, and obtain the pose of the observation camera.
Index is the key to speeding up this process. The databases themselves tend to be huge. Take the trial operation of Meituan's pouch robot on the second floor of Joy City in Chaoyang, Beijing, as an example. Three depth cameras were installed. Even after screening, nearly 80,000 900 × 600 pictures were used. Considering the real-time nature of positioning, it is impossible to compare the query with 80,000 images one by one every time, so indexing technology must be used to speed up the entire algorithm. This technology highly overlaps with loopback testing in SLAM, image retrieval, and location recognition in vision. Only general methods are introduced below. There are several feature points in an image. The feature points need to be encoded first, such as VLAD (Vector of locally aggregated descriptors) encoding, and local descriptors are used to form a global description of the image. Then use indexes, such as kd-tree, to perform image-level queries. Of course, encoding and indexing can also be performed at the same time, such as the hierarchical bag-of-words model (Bag-of-words, BoW) forward index and reverse index method. VLAD encoding VLAD (Vector of locally aggregated descriptors)[10], as shown in Fig. 7 , is a simple method that forms a codebook by aggregating local descriptors, and performs global encoding by cumulatively calculating the distance between the descriptor and the code word (Word). A Figure 7: VLAD encodes by the distance between the descriptor and the code word Here we would like to introduce DenseVLAD[11] and NetVLAD[12] in particular. Torii et al.,proved that DenseSIFT outperforms standard SIFT in both query,matching. DenseVLAD extracts SIFT points at four scales in a grid-like sampling pattern of 2 pixel intervals. Randomly sample 25M descriptors globally and use the k-means algorithm to generate a codebook of 128 codewords. The VLAD vector is dimensionally reduced using PCA (Principal component analysis) after normalization to form the final 4096-dimensional DenseVLAD vector. As shown in Fig. 8, the number of interior points (green) after matching using DenseSIFT is larger. ##Figure 8: DenseSIFT and standard SIFT feature points, comparison of interior points (green) after matching NetVLAD adds supervision information to VLAD to enhance the discriminability of VLAD encoding. As shown in Fig. 9, assume that the two descriptors red and green come from two pictures that should not be matched together. Since they are both at a larger radius and similar distance from the VLAD center (×), after L2 normalization, their encoded values will be very similar. After adding the supervision information that the pictures corresponding to the red and green descriptors do not match, the center point (★) generated by NetVLAD can better distinguish the two descriptors and increase their encoded distance (radius) difference. ##Figure 9: Comparison between NetVLAD clustering center (×) and VLAD clustering center (★)BoW Coding IndexFeature coding and its design ideas based on the bag-of-word model BoW [13, 14] play a decisive role in the development of computer vision and will not be introduced here. This article takes 2D query image matching 2D image database as an example to introduce a common BoW encoding and indexing integrated model. As shown in Fig. 10, the dictionary (Vocabulary) is generated using a hierarchical method. For all descriptors in the data set, the space is divided according to a tree structure, and each layer is calculated by k-means clustering. The final leaf nodes are equivalent to code words (there are 9 code words in Fig. 10). Figure 10: Hierarchical BoW model with forward index and reverse index The tree construction process is actually the process of encoding the original image. However, encoding itself does not speed up the search process. Similar to VLAD, it still needs to be compared one by one with the images in the database. Therefore, an inverse index (Inverse index) is designed here, which does not require comparing the encoded vectors. The principle is shown in Fig. 11. For a query image (Query image), the extracted descriptor is input into BoW and will eventually fall into the code word leaf node (Visual word) k. Each code word corresponds to an index, recording the weight of the code word Figure 11: Directly query images through the reverse index voting mechanism The main function of the forward index (Direct Index) is to record which nodes the feature points of the database image fall into when constructing the BoW. In this way, when the image is queried, there is no need to calculate the feature points. Feature points can be extracted directly through the index. 3D point cloud query In 2D image query, the image is first queried from the semantic level, so it can be The image constrains the spatial range of feature points. 3D point cloud query does not have such constraints, so it has many difficulties. If you need to consider spatial continuity, whether all the queried points are within the observable range, etc. Here we only introduce the method [15] published by Sattler at TPAMI 2016. After years of polishing, this method framework is relatively simple and complete. Since the dictionary encoding search steps overlap with the content in the previous section, only the two mechanisms of Active Search and Visbility Filtering are introduced here. Active Search is mainly to make the matched 3D points as close as possible in space and have geometric meaning. As shown in Fig. 12, the red point is matched to a point in the point cloud through a series of encoding and refinement processes (red line). According to the proposed prioritization framework, a 3D point with the highest probability is found from the point cloud, and reversely (blue line) matches a corresponding 2D point in the query image. ##Figure 12: Active Search Figure 13: Visbility Filtering Visbility Filtering The main purpose is to make the matched points as visible as possible to the camera ( Positioning is unsupervised and it is not possible to know whether the matched points are correct). The method adopted here is to create a bipartite visibility graph when using SfM to create a 3D point cloud map. As shown in Fig. 13 (left), when a point can be observed by two cameras at the same time, a topological relationship is established. In Fig. 13 (middle), the blue points are matched points, and they conflict from the observation perspective. By performing graph clustering on the existing topology, cameras are grouped into two groups, as shown in Fig. 13 (right). In this way, new graph topological relationships can be generated. Then, by judging the overlap between each sub-graph, we filter out those points that are highly likely to be invisible. It should be noted that although binocular cameras and RGB-D cameras can obtain depth, querying 2D images can also obtain 3D feature point coordinates within a limited range, but due to current technical limitations , in complex indoor materials and large-scale outdoor scenes, the depth is not reliable. Therefore, the matching of 2D image points and 3D point cloud maps is still an important method. The feature point matching process can be completed adaptively in the database query, which is more common in queries based on 3D structures . Matching can also be performed separately after the query, which is more common in 2D image-based queries. The purpose of feature matching is to provide matching point pairs for subsequent transformation matrix calculations to achieve pose calculation. Classic RANSAC Random sample consensus algorithm (Random sample consensus, RANSAC) [16] is a classic Data filtering and parameter fitting algorithms. It assumes that the distribution of data (inliers) conforms to a certain mathematical model, and through iterative calculations, it removes outliers and noise points, and at the same time obtains the best model parameters in terms of probability. In global positioning, interior points refer to correct matches, exterior points refer to incorrect matches, and the parametric model refers to the spatial transformation matrix of matching point pairs. As shown in Fig. 14, after optimization by the RANSAC algorithm, the matching is more reasonable. The matching subset that RANSAC expects to find needs to meet two indicators: the interior point reprojection error is as small as possible; the number of interior points is as large as possible. So the basic process is as follows: #① Sampling the initial subset. ② Calculate the transformation matrix. ③ Calculate the reprojection error of the matching point based on the transformation matrix. ④ Remove points with large errors ⑤ Loop ①-④ to retain the matching solution that best meets the indicators. Figure 14: (Top) Original feature matching; (Bottom) Matching optimized by RANSAC algorithm Among them, the initial candidate matching is generated based on the distance between descriptors, but the reprojection error is only related to the spatial position of the key points and has nothing to do with the descriptors themselves. For the specific projection matrix method, please refer to "2.4 Pose Calculation". It should be pointed out that the RANSAC algorithm is affected by the original matching error and parameter selection. It can only ensure that the algorithm has a high enough probability to be reasonable, and may not necessarily obtain the optimal result. The algorithm parameters mainly include threshold and number of iterations. The probability of RANSAC obtaining a credible model is directly proportional to the number of iterations, and the number of matches obtained is inversely proportional to the threshold. Therefore, in actual use, it may be necessary to repeatedly try different parameter settings to obtain better results. Scholars have made many improvements to the classic RANSAC algorithm. As shown in Fig. 15, the structure diagram of global RANSAC (Universal-RANSAC) [17] is proposed, forming a universal RANSAC algorithm. The adaptive RANSAC architecture covers almost all RANSAC improvements, such as pre-filtering, minimum subset sampling, reliable model generation from minimum subsets, parameter verification, and model refinement. ##Figure 15: Universal-RANSAC universal algorithm framework differentiableRANSAC Since manual descriptors still show high performance in the positioning field, some scholars have begun to explore the use of deep learning to replace certain parts of the algorithm framework. , instead of directly using the end-to-end pose estimation model to completely replace the traditional method. Differentiable RANSAC (DSAC) [18] aims to replace deterministic hypothesis selection with probabilistic hypothesis selection, so that the RANSAC process can be derived. The process is shown in Fig. 16, in which the "Scoring" step still uses reprojection error As an indicator, the difference is that the error is based on the entire image rather than feature points, and the original process of screening feature point matching is replaced by a process of directly screening the camera pose hypothesis h with probability. Although the current method has relatively large limitations, DSAC provides a feasible idea for how to add prior knowledge to the current unsupervised positioning algorithm framework. ##Figure 16: Differential RANSAC algorithm framework , and the homogeneous form of the transformation moment is the rotation matrix, and 2.4.1 2D-2D transformation matrix calculation Figure 17: 2D-2D transformation matrix calculation Epipolar geometry For the matched feature point pairs ( Among them, Since the essential matrix 2.4.2 2D-3D transformation matrix calculation 2D-3D matching is important in pose estimation a way. Generally, the PnP method is used, that is, where, In this way, at least 6 can be passed Solve the matching points, and when the number of matches is greater than 6, you can use SVD and other methods to solve the problem by constructing a least squares method. The P3P method can be regarded as a special solution of the PnP method. As shown in Fig. 18, it uses the similarity properties of triangles to add more constraints and only needs 3 pairs of points to solve the problem. Other solution methods include Direct linear transformation (DLT), EPnP (Efficient PnP) method, and UPnP (Uncalibrated PnP), etc. Compared with the above linear optimization methods, nonlinear optimization methods such as Bundle Adjustment (BA) are also widely used. The BA method is a kind of "one-size-fits-all" existence in visual SLAM. It can optimize multiple variables at the same time, which can alleviate the system instability caused by local errors to a certain extent. Interested students can read the relevant information for a more in-depth understanding. . ##Figure 18: P3P method in 2D-3D transformation matrix calculation 3D-3D transformation matrix calculation The transformation matrix between 3D points can be solved using the iterative closest point (ICP) algorithm. Assuming that the point pair matching ( or use the nonlinear optimization method Bundle Adjustment based on Lie algebra to solve Among them, The ICP problem has been proven to have a unique solution and infinite solutions. Therefore, when there is a unique solution, the optimization function is equivalent to a convex function, and the minimum value is the global optimal solution. No matter what kind of initialization is adopted, this unique solution can be obtained. This is one of the great advantages of the ICP method. This article introduces the pose estimation algorithm based on feature points from four aspects: image description, mapping query, feature matching, and pose calculation. Although the traditional visual global positioning method is still the first choice in practical applications, the traditional method is based on the premise that the feature points are correctly defined, correctly extracted, correctly matched, and correctly observed. This premise is very important to the vision itself. It's a huge challenge. Secondly, since the traditional method is a multi-stage framework rather than end-to-end, each link and the interaction between links require numerous parameter adjustments, and the technology of each link can be used as a separate research direction. . In actual application, a large number of tricks corresponding to specific scenarios need to be added, which makes the engineering more complex. And people’s expectations for the end-to-end method have given rise to networks such as PoseNet, VLocNet, HourglassNet, etc., which have achieved good results on benchmarks. The author believes that there are still many problems in the current end-to-end method. The main ones are that the loss function lacks geometric constraints, the 6-degree-of-freedom space of pose when constructing the map is not continuous, and it is difficult to form a good mapping with the input space, and there is a lack of corresponding position. posture regression, refinement mechanism, etc. It cannot be denied that as the most powerful modeling tool for nonlinear space, deep learning will appear more in the field of positioning in the future. Returning to visual positioning itself, the most important advantages of vision are low cost, rich semantics, and few restrictions on usage scenarios. Therefore, positioning fusion solutions that focus on vision and are supplemented by other low-cost sensors will also be an important topic in the future.  dimensional descriptor
  is encoded through a codebook of
  codewords to form a
  dimension description vector, the value in the vector is the difference between the descriptor and the
  th code word in the
  th dimension. Then perform
  normalization to form the final VLAD vector.


 to the
  th picture in the database
  (Fig. 10). Here the weight is calculated using TF-IDF (Term frequency–inverse document frequency). That is, if a word
  appears frequently in a certain image
  and has a low frequency in other images, then this word has better image discriminability and the weight value
  Higher. Finally, the matching image is selected through the voting mechanism. It should also be noted that the reverse index is not necessarily built on the tree-structured BoW, it just provides a method of fast query.


Feature point matching


For the correct matching point pairs that have been obtained, the corresponding transformation matrix (Transformation matrix) needs to be calculated through geometric constraints. Since the point coordinates in the database and the camera pose at the time of sampling are known, the current camera pose can be obtained by matching the transformation matrix of the point to the map point. Some basic symbols are defined here. The internal parameters of the camera are
 is:
is: 

 is the translation matrix.

 ) in the two two-dimensional images, they are on the normalized plane The coordinates are (
 ), and the corresponding transformation matrix needs to be calculated through epipolar constraints. As shown in Fig. 17, its geometric meaning is that
  are three coplanar. This surface is also called the polar plane,
  is called the baseline, and
  is called the polar line. The epipolar constraint includes both translation and rotation, which is defined as:
 is
is  Coordinates on the normalized plane, ∧ is the outer product operator. Calculate the middle part of the formula as the basic matrix
  and the essential matrix
  , then we have:
  ##
## does not have scale information, the epipolar constraint still holds after E is multiplied by any non-zero constant.
  can be solved by the classic 8-point method (Eight-point-algorithm), and then decomposed to get
  ,
,  . Therefore, it can be seen that the 2D-2D transformation matrix solution method has two shortcomings. First, monocular vision has scale uncertainty, and the scale information needs to be provided by
  during initialization. Correspondingly, monocular initialization cannot only be pure rotation, but must have a sufficient degree of translation, otherwise
  will result in zero.
  is known to solve the transformation matrix for the 2D-3D matching points to obtain the camera pose. We project the 3D point P(X, Y, Z) onto the camera imaging plane (
 ):
): 
 is the scale,
  . The solution of this equation can be reduced to a linear equation problem, and each feature can provide two linear constraints:

 ) result is correct, the obtained transformation matrix should minimize the reprojection error
  . You can use SVD to solve the least squares problem:

 represents the camera pose. The optimization goal here is similar to that of Bundle Adjustment in 2D-3D matching, but there is no need to consider the camera internal parameters
  because the original image has been processed by the binocular camera or RGB-D depth camera. 2D points are projected from the camera imaging plane into the 3D world.
The above is the detailed content of Global positioning technology based on feature points in autonomous driving using Wanzi analysis. For more information, please follow other related articles on the PHP Chinese website!

 Reading The AI Index 2025: Is AI Your Friend, Foe, Or Co-Pilot?Apr 11, 2025 pm 12:13 PM
The 2025 Artificial Intelligence Index Report released by the Stanford University Institute for Human-Oriented Artificial Intelligence provides a good overview of the ongoing artificial intelligence revolution. Let’s interpret it in four simple concepts: cognition (understand what is happening), appreciation (seeing benefits), acceptance (face challenges), and responsibility (find our responsibilities). Cognition: Artificial intelligence is everywhere and is developing rapidly We need to be keenly aware of how quickly artificial intelligence is developing and spreading. Artificial intelligence systems are constantly improving, achieving excellent results in math and complex thinking tests, and just a year ago they failed miserably in these tests. Imagine AI solving complex coding problems or graduate-level scientific problems – since 2023
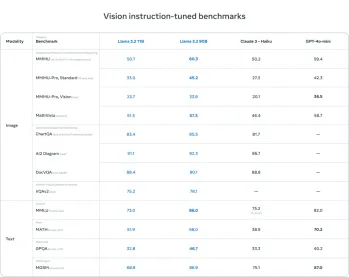
 Getting Started With Meta Llama 3.2 - Analytics VidhyaApr 11, 2025 pm 12:04 PM
Meta's Llama 3.2: A Leap Forward in Multimodal and Mobile AI Meta recently unveiled Llama 3.2, a significant advancement in AI featuring powerful vision capabilities and lightweight text models optimized for mobile devices. Building on the success o
 AV Bytes: Meta's Llama 3.2, Google's Gemini 1.5, and MoreApr 11, 2025 pm 12:01 PM
This week's AI landscape: A whirlwind of advancements, ethical considerations, and regulatory debates. Major players like OpenAI, Google, Meta, and Microsoft have unleashed a torrent of updates, from groundbreaking new models to crucial shifts in le
 The Human Cost Of Talking To Machines: Can A Chatbot Really Care?Apr 11, 2025 pm 12:00 PM
The comforting illusion of connection: Are we truly flourishing in our relationships with AI? This question challenged the optimistic tone of MIT Media Lab's "Advancing Humans with AI (AHA)" symposium. While the event showcased cutting-edg
 Understanding SciPy Library in PythonApr 11, 2025 am 11:57 AM
Introduction Imagine you're a scientist or engineer tackling complex problems – differential equations, optimization challenges, or Fourier analysis. Python's ease of use and graphics capabilities are appealing, but these tasks demand powerful tools
 3 Methods to Run Llama 3.2 - Analytics VidhyaApr 11, 2025 am 11:56 AM
Meta's Llama 3.2: A Multimodal AI Powerhouse Meta's latest multimodal model, Llama 3.2, represents a significant advancement in AI, boasting enhanced language comprehension, improved accuracy, and superior text generation capabilities. Its ability t
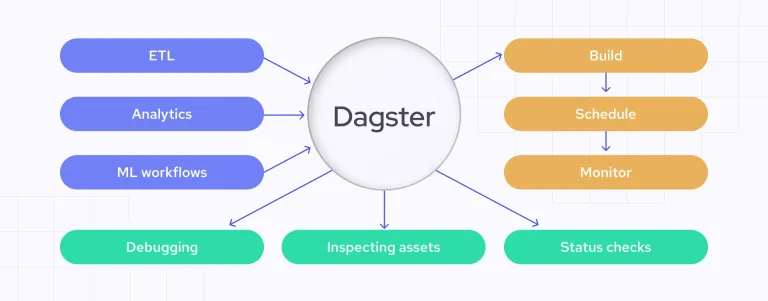 Automating Data Quality Checks with DagsterApr 11, 2025 am 11:44 AM
Data Quality Assurance: Automating Checks with Dagster and Great Expectations Maintaining high data quality is critical for data-driven businesses. As data volumes and sources increase, manual quality control becomes inefficient and prone to errors.
 Do Mainframes Have A Role In The AI Era?Apr 11, 2025 am 11:42 AM
Mainframes: The Unsung Heroes of the AI Revolution While servers excel at general-purpose applications and handling multiple clients, mainframes are built for high-volume, mission-critical tasks. These powerful systems are frequently found in heavil


Hot AI Tools

Undresser.AI Undress
AI-powered app for creating realistic nude photos

AI Clothes Remover
Online AI tool for removing clothes from photos.

Undress AI Tool
Undress images for free

Clothoff.io
AI clothes remover

AI Hentai Generator
Generate AI Hentai for free.

Hot Article
Hot Tools

mPDF
mPDF is a PHP library that can generate PDF files from UTF-8 encoded HTML. The original author, Ian Back, wrote mPDF to output PDF files "on the fly" from his website and handle different languages. It is slower than original scripts like HTML2FPDF and produces larger files when using Unicode fonts, but supports CSS styles etc. and has a lot of enhancements. Supports almost all languages, including RTL (Arabic and Hebrew) and CJK (Chinese, Japanese and Korean). Supports nested block-level elements (such as P, DIV),

DVWA
Damn Vulnerable Web App (DVWA) is a PHP/MySQL web application that is very vulnerable. Its main goals are to be an aid for security professionals to test their skills and tools in a legal environment, to help web developers better understand the process of securing web applications, and to help teachers/students teach/learn in a classroom environment Web application security. The goal of DVWA is to practice some of the most common web vulnerabilities through a simple and straightforward interface, with varying degrees of difficulty. Please note that this software

SecLists
SecLists is the ultimate security tester's companion. It is a collection of various types of lists that are frequently used during security assessments, all in one place. SecLists helps make security testing more efficient and productive by conveniently providing all the lists a security tester might need. List types include usernames, passwords, URLs, fuzzing payloads, sensitive data patterns, web shells, and more. The tester can simply pull this repository onto a new test machine and he will have access to every type of list he needs.

Notepad++7.3.1
Easy-to-use and free code editor

MinGW - Minimalist GNU for Windows
This project is in the process of being migrated to osdn.net/projects/mingw, you can continue to follow us there. MinGW: A native Windows port of the GNU Compiler Collection (GCC), freely distributable import libraries and header files for building native Windows applications; includes extensions to the MSVC runtime to support C99 functionality. All MinGW software can run on 64-bit Windows platforms.

