Home >Web Front-end >JS Tutorial >Implementing the effect of Baidu map ABCD marker based on OL2_javascript skills
Implementing the effect of Baidu map ABCD marker based on OL2_javascript skills
- WBOYWBOYWBOYWBOYWBOYWBOYWBOYWBOYWBOYWBOYWBOYWBOYWBOriginal
- 2016-05-16 15:37:251465browse
Overview of this article:
As mentioned above, the marker effect of Baidu Map ABCD is implemented in Arcgis for JS. In this article, we will describe how to achieve similar effects in OpenLayers2.
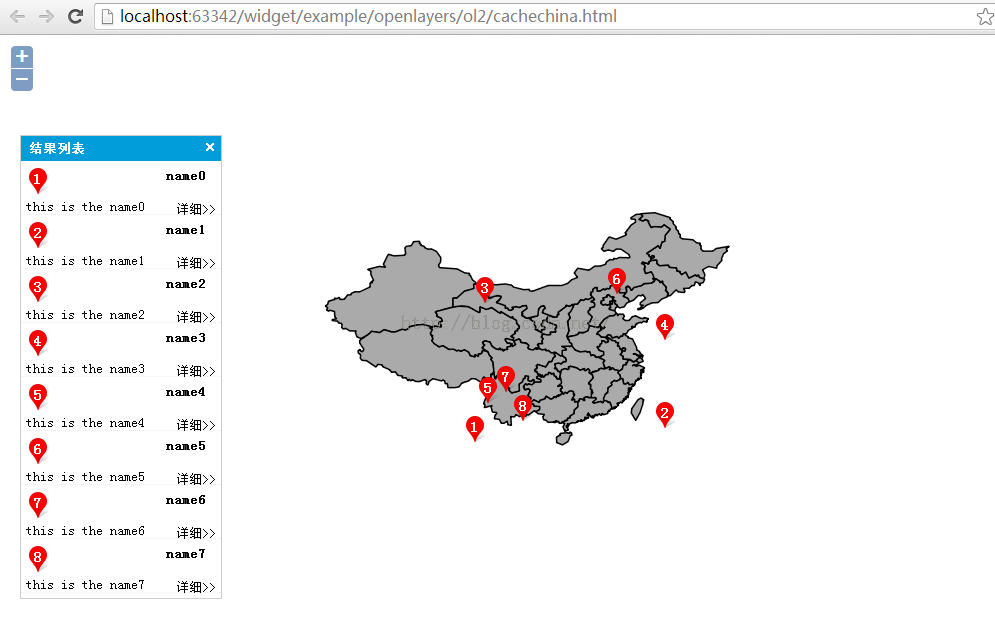
The renderings are shown below:
For the sake of visualization, the effect will be posted first.


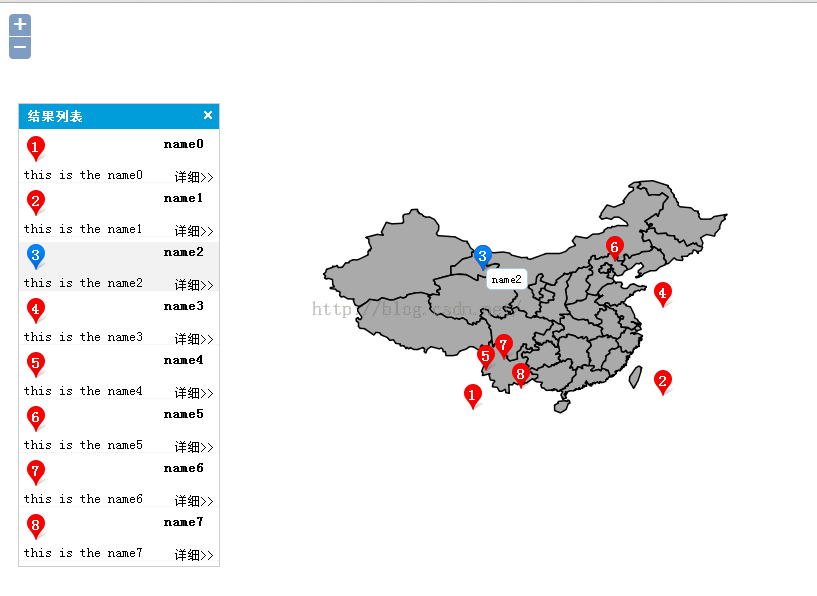
Linked display
Things:
1. Interaction between list and map
When the mouse passes over the list, the list icon is modified and a blue marker is drawn on the map based on the value returned by the list; when the mouse is moved out, the list icon is modified to red and the map marker layer is cleared.
Key code:
title.on("mouseover",function(){
  var i = $(this).attr("i");
  $("#img"+i).attr("src","img/blue.png");
  var data = $(this).data("attr");
  var hpt = new OpenLayers.LonLat(data.x,data.y);
  var hicon = new OpenLayers.Icon('img/blue.png',size,offset);
  hMarker = new OpenLayers.Marker(hpt,hicon);
  markerLyr.addMarker(hMarker);
  showName(hpt,data.name,"item-label-name");
});
title.on("mouseout",function(){
  var i = $(this).attr("i");
  $("#img"+i).attr("src","img/red.png");
  markerLyr.removeMarker(hMarker);
  hlabelLyr.clear();
});
title.on("click",function(){
  var data = $(this).data("attr");
  showInfowindow(data.name,data.desc);
});
2. Interaction between map and list
When the mouse passes over the red marker on the map, the corresponding list icon is modified and the red marker picture is changed to blue; when the mouse is moved out, the corresponding list icon is modified and the marker is changed to red.
Key code:
marker.events.register("click", feature, function(e){
  var data = e.object.attr;
  showInfowindow(data.name,data.desc);
});
marker.events.register("mouseover", feature, function(e){
  map.layerContainerDiv.style.cursor = "pointer";
  var id= e.object.id;
  $("#img"+id).attr("src","img/blue.png");
  $("#li"+id).css("background","#f2f2f2");
  var data = e.object.attr;
  var hpt = new OpenLayers.LonLat(data.x, data.y);
  showName(hpt,data.name,"item-label-name-map");
});
marker.events.register("mouseout", feature, function(e){
  map.layerContainerDiv.style.cursor = "url("
    + OpenLayers.Util.getRootPath()
    + "img/pan.cur),default";
  var id= e.object.id;
  $("#img"+id).attr("src","red.png");
  $("#li"+id).css("background","#ffffff");
  hlabelLyr.clear();
});
markerLyr.addMarker(marker);
var label = new OpenLayers.Label(pt,i+1,"item-label");
labelLyr.add(label);
3. The numbers 1, 2, 3, 4... etc. on the map are a label layer and do not participate in linkage;
4. The data is transmitted in the form of JSON. In this example, it is dynamically generated based on the four directions of the map, as follows:
function getRandomXY(){
  var json = new Array();
  for(var i=0;i<8;i++){
    var w = bounds.getWidth();
    var h = bounds.getHeight();
    var x = Math.random() * w + bounds.left;
    var y = Math.random() * h + bounds.bottom;
    json.push({
      id:i,
      name:"name"+i,
      desc:"this is the name"+i,
      x:x,
      y:y
    })
  }
  return json;
}
The complete code is as follows:
<!DOCTYPE html>
<html>
<head lang="en">
  <meta charset="UTF-8">
  <title>openlayers map</title>
  <link rel="stylesheet" type="text/css" href="http://localhost/olapi/theme/default/style.css"/>
  <style>
    html, body, #map{
      padding:0;
      margin:0;
      height:100%;
      width:100%;
      overflow: hidden;
      font-size: 12.5px;
      font-family:"宋体"
    }
    .item-list{
      position: absolute;
      top:100px;
      left: 20px;
      z-index: 999;
      border: 1px solid #ccc;
      width: 200px;
      background: #fff;
    }
    .list-close{
      background: url("img/panel_tools.png");
      width: 16px;
      height: 16px;
      float: right;
      margin: 3px 3px;
      background-position: -16px 0px;
    }
    .list-close:hover{
      cursor: pointer;
    }
    .list-title{
      background: #009dda;
      color: #fff;
      padding: 5px 8px;
      font-weight: bold;
    }
    ul{
      list-style: none;
      margin: -0px 0;
    }
    ul li{
      border-bottom: 1px dotted #eee;
      margin-left: -40px;
      margin-top: 5px;
      position: relative;
    }
    ul li:hover{
      background: #f2f2f2;
    }
    .item{
      padding: 2px 5px;
    }
    .item:hover{
      cursor: pointer;
    }
    .item-num{
      position: absolute;
      top: 4px;
      left: 12px;
      color:#fff;
      font-size: 15px;
      font-weight: bold;
    }
    .item-title{
      float: right;
      font-weight: bold;
      margin-right: 10px;
    }
    .item-content{
      padding: 3px 5px;
    }
    .item-detail{
      margin: 3px 5px;
      float: right;
    }
    .item-detail:hover{
      text-decoration: underline;
      color: #01A4F8;
      cursor: pointer;
    }
    .item-label{
      color:#fff;
      font-size: 15px;
      font-weight: bold;
      margin-top: 2px;
      margin-left: 7px;
    }
    .item-label-name,.item-label-name-map{
      border:1px solid #a6c9e2;
      background: #fff;
      padding: 3px 5px;
      font-size: 12px;
      margin-top: 23px;
      margin-left: 15px;
      border-radius: 5px;
    }
    .item-label-name-map{
      margin-left: 25px;
    }
  </style>
  <!--引入jquery 库 -->
  <script type="text/javascript" src="http://localhost/olapi/OpenLayers.js"></script>
  <script type="text/javascript" src="http://localhost/olapi/lib/OpenLayers/Lang/zh-CN.js"></script>
  <script src="http://localhost/jquery/jquery-1.8.3.js"></script>
  <script src="extend/LabelLayer.js"></script>
  <script>
    var map;
    var tiled;
    $(window).load(function() {
      var bounds = new OpenLayers.Bounds(
          87.57582859314434, 19.969920291221204,
          126.56713756740385, 45.693810203800794
      );
      var options = {
        controls: [],
        maxExtent: bounds,
        maxResolution: 0.1523098006807012,
        projection: "EPSG:4326",
        units: 'degrees'
      };
      map = new OpenLayers.Map('map', options);
      map.addControl(new OpenLayers.Control.Zoom());
      map.addControl(new OpenLayers.Control.Navigation());
      map.addControl( new OpenLayers.Control.MousePosition());
      var tiled = new OpenLayers.Layer.WMS(
          "province", "http://localhost:8088/geoserver/lzugis/wms",
          {
            "LAYERS": 'province',
            "STYLES": '',
            format: 'image/png'
          },
          {
            buffer: 0,
            displayOutsideMaxExtent: true,
            isBaseLayer: true,
            yx : {'EPSG:4326' : true}
          }
      );
      var markerLyr = new OpenLayers.Layer.Markers("marker");
      var labelLyr = new OpenLayers.Layer.Labels("label");
      var hlabelLyr = new OpenLayers.Layer.Labels("hlabelLyr");
      map.addLayers([tiled,markerLyr,labelLyr,hlabelLyr]);
      map.zoomToExtent(bounds);

      var data = getRandomXY();
      console.log(data);
      var ul = $("#items");
      var size = new OpenLayers.Size(24,26);
      var offset = new OpenLayers.Pixel(0, 0);
      var hMarker=null;
      for(var i=0;i<data.length;i++) {
        /**
         * 地图内容
         */
        var pt = new OpenLayers.LonLat(data[i].x, data[i].y);
        var icon = new OpenLayers.Icon('img/red.png',size,offset);
        var feature = new OpenLayers.Feature(markerLyr,
            pt,
            {'icon': icon,'attr':data[i]});
        var marker = feature.createMarker();
        marker.attr = data[i];
        marker.id = i;
        marker.events.register("click", feature, function(e){
          var data = e.object.attr;
          showInfowindow(data.name,data.desc);
        });
        marker.events.register("mouseover", feature, function(e){
          map.layerContainerDiv.style.cursor = "pointer";
          var id= e.object.id;
          $("#img"+id).attr("src","img/blue.png");
          $("#li"+id).css("background","#f2f2f2");
          var data = e.object.attr;
          var hpt = new OpenLayers.LonLat(data.x, data.y);
          showName(hpt,data.name,"item-label-name-map");
        });
        marker.events.register("mouseout", feature, function(e){
          map.layerContainerDiv.style.cursor = "url("
            + OpenLayers.Util.getRootPath()
            + "img/pan.cur),default";
          var id= e.object.id;
          $("#img"+id).attr("src","red.png");
          $("#li"+id).css("background","#ffffff");
          hlabelLyr.clear();
        });
        markerLyr.addMarker(marker);
        var label = new OpenLayers.Label(pt,i+1,"item-label");
        labelLyr.add(label);
        /**
         * 列表内容
         */
        var li = $("<li />").attr("id","li"+i).appendTo(ul);
        var title = $("<div />").addClass("item").attr("i",i).data("attr",data[i]);
        var img = $("<img />").attr("id","img"+i).attr("src", "img/red.png")/*.attr("width", "16").attr("height", "18")*/;
        var num = $("<a />").addClass("item-num").html(i+1);
        var name = $("<div />").addClass("item-title").html(data[i].name);
        title.append(img).append(num).append(name);
        var content = $("<a />").addClass("item-content").html(data[i].desc);
        var detail = $("<a />").addClass("item-detail").html("详细>>");
        li.append(title).append(content).append(detail);
        title.on("mouseover",function(){
          var i = $(this).attr("i");
          $("#img"+i).attr("src","img/blue.png");
          var data = $(this).data("attr");
          var hpt = new OpenLayers.LonLat(data.x,data.y);
          var hicon = new OpenLayers.Icon('img/blue.png',size,offset);
          hMarker = new OpenLayers.Marker(hpt,hicon);
          markerLyr.addMarker(hMarker);
          showName(hpt,data.name,"item-label-name");
        });
        title.on("mouseout",function(){
          var i = $(this).attr("i");
          $("#img"+i).attr("src","img/red.png");
          markerLyr.removeMarker(hMarker);
          hlabelLyr.clear();
        });
        title.on("click",function(){
          var data = $(this).data("attr");
          showInfowindow(data.name,data.desc);
        });
      }

      $(".item-list").draggable({
        handle:'.list-title'
      });
      $("#close").on("click",function(){
        $(".item-list").hide();
      });

      function showName(pt,name,classname){
        var label = new OpenLayers.Label(pt,name,classname);
        hlabelLyr.add(label);
      }
      function showInfowindow(title,content){
        $("<div />").window({
          width:200,
          height:80,
          modal:true,
          maximizable:false,
          minimizable:false,
          collapsible:false,
          closable:true,
          title:title,
          content:content
        });
      }

      function getRandomXY(){
        var json = new Array();
        for(var i=0;i<8;i++){
          var w = bounds.getWidth();
          var h = bounds.getHeight();
          var x = Math.random() * w + bounds.left;
          var y = Math.random() * h + bounds.bottom;
          json.push({
            id:i,
            name:"name"+i,
            desc:"this is the name"+i,
            x:x,
            y:y
          })
        }
        return json;
      }
    });
  </script>
</head>
<body>
<div id="map"></div>
  <div class="item-list">
    <div id="close" class="list-close"></div>
    <div class="list-title">结果列表</div>
    <ul id="items">
    </ul>
  </div>
</body>
</html>
In this example, the layer Labels and object Labels of OpenLayers are extended.
The above is the entire description of this article, I hope you all like it.
Related articles
See more- An in-depth analysis of the Bootstrap list group component
- Detailed explanation of JavaScript function currying
- Complete example of JS password generation and strength detection (with demo source code download)
- Angularjs integrates WeChat UI (weui)
- How to quickly switch between Traditional Chinese and Simplified Chinese with JavaScript and the trick for websites to support switching between Simplified and Traditional Chinese_javascript skills

