Home >Web Front-end >JS Tutorial >Learn more about how to debug nodejs programs
Learn more about how to debug nodejs programs
- 青灯夜游forward
- 2021-05-24 10:44:222416browse

For developers, in the process of developing applications, they often need to resort to the debugging function of the programming language for the convenience of development and to solve bugs. Generally speaking, we need to use the debugging function of a powerful IDE to complete this work. nodejs is no exception.
Today we will introduce in detail how to debug nodejs programs.
Enable nodejs debugging
Do you remember the koa program we talked about before? This article will take a simple koa server program as an example to start debugging nodejs.
Let’s first look at a simple koa service app.js:
const Koa = require('koa');
const app = module.exports = new Koa();

app.use(async function(ctx) {
  ctx.body = 'Hello World';
});

if (!module.parent) app.listen(3000);
The above program opens port 3000 and establishes an http service. Every time a request is made, hello World will be returned, which is very simple.
To run the above program, we need to execute node app.js. This will execute app.js but will not enable debugging. [Recommended learning: "nodejs Tutorial"]
How to debug?
We need to add the --inspect parameter:
node --inspect app.js
The above code will enable the debugging function of nodejs.
Let’s take a look at the output:
Debugger listening on ws://127.0.0.1:9229/88c23ae3-9081-41cd-98b0-d0f7ebceab5a
For help, see: https://nodejs.org/en/docs/inspector
The results tell us two things. The first thing is the port that the debugger listens to. By default, port 9229 of 127.0.0.1 will be opened. And assigned a unique UUID for differentiation.
The second thing is to tell us that the debugger used by nodejs is Inspector.
Inspector was introduced after nodejs 8. If it is before nodejs 7, then the legacy debugger is used.
Debugging security
If the debugger is connected to the nodejs running environment, if there is a malicious attacker, the malicious attacker can run arbitrary code in the nodejs environment. This will bring great security risks to our program.
So we must pay attention to the safety of debugging. Generally speaking, we do not recommend remote debugging.
By default, --inspect is bound to 127.0.0.1, which only allows local programs to access. And any locally running program has permission to debug the program.
If we really want to expose the debug program to external programs, we can specify the external IP address of the machine or 0.0.0.0 (indicating any address, no restrictions), so that the remote machine can perform remote Debugged.
What should we do if we want to perform safe remote debugging?
First, we need to enable local debugging:
node --inspect app.js
Then we can build an ssh tunnel to map the local 9221 port to the remote server's 9229 port:
ssh -L 9221:localhost:9229 user@remote.example.com
In this way, we can perform remote debugging by connecting to the local 9221 port.
Use WebStorm for nodejs debugging
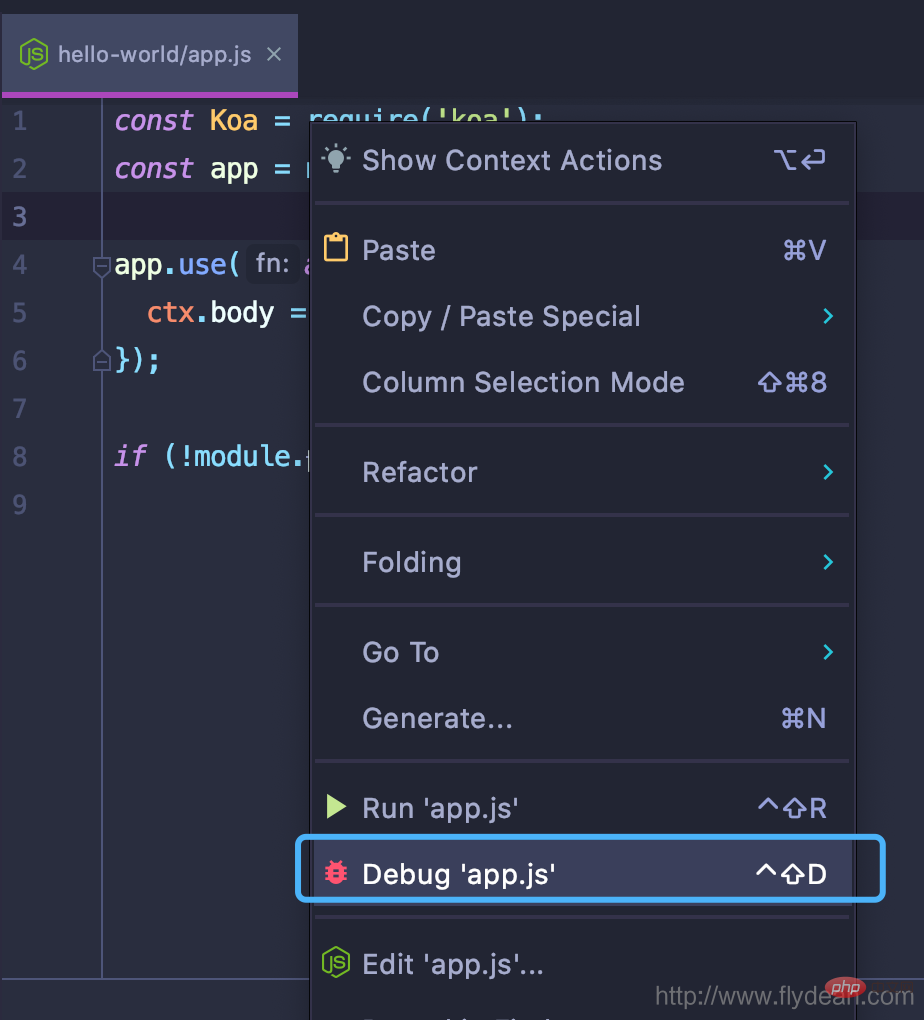
WebStorm produced by JetBrains can be said to be a powerful tool for developing nodejs. WebStorm has its own debug option. If this option is turned on, --inspect:# will be turned on in the background.


node inspect app.js

2eeb910a2be79e2227cae7c992736c7b 1 const Koa = require('koa');
  2 const app = module.exports = new Koa();
  3
debug>
node inspect does two things. The first thing is to generate a subroutine to run node --inspect app.js. The second thing is to Run the CLI debug window in the program. This CLI debugger provides us with some very useful commands:
- Stepping
- cont, c: Continue execution
- next, n: Step to the next step
- step, s: Step in
- out, o: Step out
- pause: Pause the running code
- Breakpoints
- setBreakpoint(), sb(): Set a breakpoint on the current line
- setBreakpoint(line), sb(line): Set a breakpoint on the specified line
- setBreakpoint('fn()' ), sb(…): Set a breakpoint in the specified function
- setBreakpoint('script.js', 1), sb(…): Set a breakpoint in the specified script file
- clearBreakpoint('script.js', 1), cb(…): Clear breakpoints from the file
- Information
- backtrace , bt: Print the backtrace information of the current execution frame
- list(5): List the 5 lines before and after the source code
- watch(expr): Add the monitoring expression
- unwatch(expr): Delete the watch expression
- watchers: List all watchers
- repl: Open the repl expression
- exec expr: Execute the expression
Through the above command, we can perform more complex debugging activities in the CLI.
Other debug clients
In addition to the ones we mentioned above, we can also use vscode, Visual Studio, Eclipse IDE, etc. to debug nodejs, which are not the same here. One is introduced in detail.
Interested friends can explore on their own.
Author of this article: Those things about flydean program
Link to this article: http://www.flydean.com/nodejs-debug/
Source of this article: flydean Blog
For more programming-related knowledge, please visit: Introduction to Programming! !
The above is the detailed content of Learn more about how to debug nodejs programs. For more information, please follow other related articles on the PHP Chinese website!
Related articles
See more- Let's talk about four ways to get parameters in Nodejs
- An in-depth analysis of processes and threads in Node.js
- Use string_decoder module in Nodejs to convert buffer into string
- How to solve the error when setting NODE_ENV in nodejs?
- What is the difference in performance between php7, java8, nodejs5 and lua5.2

