
 Backend DevelopmentPython TutorialIntroducing the common drawing functions of python's matplotlib
Introducing the common drawing functions of python's matplotlib


Free learning recommendation: python video tutorial
matplotlib has powerful drawing functions, But the sentences are trivial, and it would be too troublesome to write them sentence by sentence every time they are used. This article summarizes common drawing functions based on daily drawing experience, which can be used directly and is very convenient
import matplotlib.pyplot as pltimport pandas as pdimport numpy as np
plt.rcParams['font.sans-serif']=['simhei']#用于正常显示中文标签plt.rcParams['axes.unicode_minus']=False#用于正常显示负号
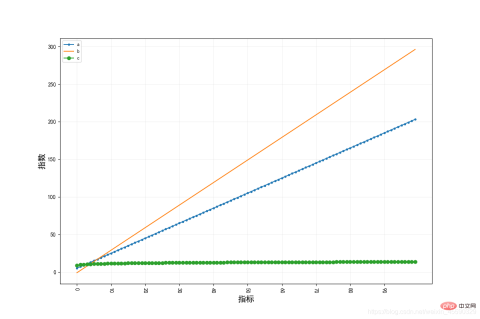
1. Draw using DataFrame tables containing multiple columns of data
def plot_cols(data,xlabel=None,ylabel=None,path_file=None,marker=True,len_xticks=10,save=False):
    """
    :param data:DataFrame,数据表格--行标题为横坐标,列标题为数据列
                Series,序列——行标题为横坐标,name为数据列
    :param xlabel: str,横坐标名称
    :param ylabel: str,纵坐标名称
    :param path_file: str,保存文件路径
    :param marker: bool,是否为每条线添加不同的标记
    :param len_xticks:int,横坐标显示的值个数
    :param save: bool,是否保存图片
    example:
        data=pd.DataFrame(np.random.random((100,3)),index=np.arange(100),columns=['a','b','c'])
        plot_cols(data,xlabel='指标',ylabel='指数')
    """
    data.index=data.index.astype(str)
    plt.figure(figsize=(12,8))
    markers=['.',',','o','v','^','','1','2','3','4','s','p','*','h','H','+','x','D','d','|','_']#标记符号

    #如果是DataFrame表格形式,则画出多列;如果是Series,则画出单列
    if type(data) is pd.core.frame.DataFrame:
        #是否为每条线添加不同的符号
        if marker==False:
            for col in data.columns:
                plt.plot(data[col],marker='o',label=col)
        else:
            for col,marker_ in zip(data.columns,markers):
                plt.plot(data[col], marker=marker_, label=col)

    elif type(data) is pd.core.series.Series:
        plt.plot(data, marker='o', label=data.name)

    plt.legend(loc='best',fontsize='small')
    xticks=np.linspace(0,len(data),(len_xticks+1)).astype(int).tolist()[:-1]#被显示的横坐标刻度值的位置
    plt.xticks(data.index[xticks],rotation=270)
    plt.ylabel(ylabel,fontsize=15)
    plt.xlabel(xlabel,fontsize=15)
    plt.grid(True,alpha=0.2)
    if save==True:plt.savefig(path_file)if __name__=='__main__':
    x=np.arange(1,101)
    data = pd.DataFrame({'a':x*2+3,'b':x*3-4,'c':np.log(x)+9}, index=np.arange(100))
    plot_cols(data, xlabel='指标', ylabel='指数')
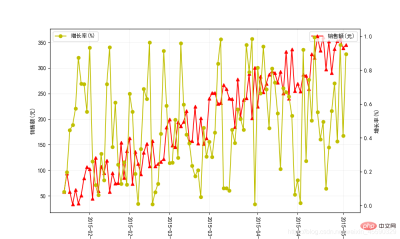
2. Convert the DataFrame table data containing two columns into a dual-axis chart
def plot_twins(data,col1,col2,xlabel=None,ylabel1=None,ylabel2=None,len_xticks=10,figsize=(10,6),save_path=None):
    """将含有两列的DataFrame表格数据作为双轴图
    :param data: DataFrame,含有两列的DataFrame表格数据
    :param col1: str,左图列标题
    :param col2: str,右图列标题
    :param xlabel: str,横轴标题
    :param ylabel1: str,左y轴标题
    :param ylabel2: str,右y轴标题
    :param len_xticks: int,显示的刻度个数
    :param figsize: turple,图大小
    :param save_path: str,图片保存路径。默认为None,不保存图片
    :return:
    example:
        x=np.arange(0,100)
        data=pd.DataFrame({'销售额(元)':3*x+np.random.random(100)*100,'增长率(%)':np.random.random(100)},index=pd.date_range('2015-01-23',periods=100,freq='D'))
        plot_twins(data,col1='销售额(元)',col2='增长率(%)',xlabel=None,ylabel1='销售额(元)',ylabel2='增长率(%)')
    """
    fig=plt.figure(figsize=figsize)#创建一块总画布
    # 将画板分为四行四列共16个单元格,(0, 0)表示从第一行第一列即第一个单元格开始画图,将第一行的三个单元格作为一个画块作画
    ax=plt.subplot2grid((1,1),(0,0),rowspan=1,colspan=1)

    plt.plot(data[col1],label=col1,color='r',marker='^')
    ax.legend(loc='upper right')#用于显示画布ax的图,切记用 loc= 表示位置
    ax.set_ylabel(ylabel1)
    xticks=np.linspace(0,len(data),(len_xticks+1)).astype(int).tolist()[:-1]#被显示的横坐标刻度值的位置
    ax.set_xticks(data.index[xticks])
    plt.xticks(rotation=270)

    twin=ax.twinx()
    plt.plot(data[col2],label=col2,color='y',marker='o')
    twin.legend(loc='upper left')
    twin.set_ylabel(ylabel2)
    ax.set_xlabel(xlabel)
    ax.grid(True,alpha=0.2)
    if save_path!=None: plt.savefig(save_path)if __name__=='__main__':
        x=np.arange(0,100)
        data=pd.DataFrame({'销售额(元)':3*x+np.random.random(100)*100,'增长率(%)':np.random.random(100)},index=pd.date_range('2015-01-23',periods=100,freq='D'))
        plot_twins(data,col1='销售额(元)',col2='增长率(%)',xlabel=None,ylabel1='销售额(元)',ylabel2='增长率(%)')
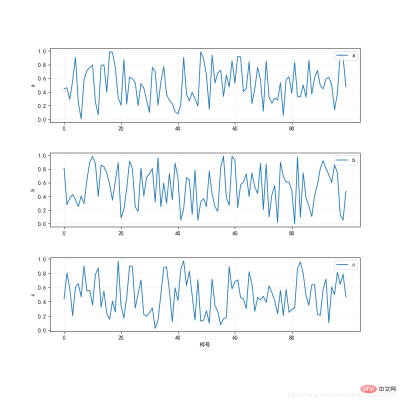
3. Convert the DataFrame Multiple columns of data in the table are drawn into multiple graphs
def plot_figs(data,xlabel=None,ylabels=None,save_path=None,len_xticks=5,length=10,width=3,intervals=1):
    """
    将DataFrame表格中的多列数据绘制成多个图
    :param data:DataFrame,含有多列的表格
    :param xlabel:str,横轴标题
    :param ylabels:list,各个图的纵轴标题
    :param path_save:str,图片保存路径。默认为None,不保存图片
    :param len_xticks: int,显示的刻度个数
    :param length:int,画板长度
    :param width:int,图画宽度
    :param intervals:int,图画之间间隔距离
    :return:
    example:
        data=pd.DataFrame(np.random.random((100,3)),index=np.arange(100),columns=['a','b','c'])
        plot_figs(data,xlabel='标号',ylabels=['a','b','c'])
    """

    cols=data.columns
    num_fig = len(data.columns)
    fig = plt.figure(figsize=(length, 4*num_fig))  # 创建一块总画布
    for i in range(0,num_fig):
        #i=2

        ax = plt.subplot2grid((num_fig*(width+intervals), 1), (i*(width+intervals), 0), rowspan=width,
                               colspan=1)  # 将画板分为四行四列共16个单元格,(0, 0)表示从第一行第一列即第一个单元格开始画图,将第一行的三个单元格作为一个画块作画

        ax.plot(data[cols[i]], label=cols[i])
        ax.legend(loc='upper right')  # 用于显示画布ax1的图,切记用 loc= 表示位置
        if ylabels!=None:ax.set_ylabel(ylabels[i])
        if xlabels!=None and i==(num_fig-1):ax.set_xlabel(xlabel)
        xticks = np.linspace(0, len(data), (len_xticks + 1)).astype(int).tolist()[:-1]  # 被显示的横坐标刻度值的位置
        ax.set_xticks(data.index[xticks])
        plt.grid(True,alpha=0.2)
    if save_path != None: plt.savefig(save_path)if __name__=='__main__':
    data=pd.DataFrame(np.random.random((100,3)),index=np.arange(100),columns=['a','b','c'])
    plot_figs(data,xlabel='标号',ylabels=['a','b','c'])
##Related free learning recommendations: python tutorial(video)
The above is the detailed content of Introducing the common drawing functions of python's matplotlib. For more information, please follow other related articles on the PHP Chinese website!

 Python vs. C : Learning Curves and Ease of UseApr 19, 2025 am 12:20 AM
Python is easier to learn and use, while C is more powerful but complex. 1. Python syntax is concise and suitable for beginners. Dynamic typing and automatic memory management make it easy to use, but may cause runtime errors. 2.C provides low-level control and advanced features, suitable for high-performance applications, but has a high learning threshold and requires manual memory and type safety management.
 Python vs. C : Memory Management and ControlApr 19, 2025 am 12:17 AM
Python and C have significant differences in memory management and control. 1. Python uses automatic memory management, based on reference counting and garbage collection, simplifying the work of programmers. 2.C requires manual management of memory, providing more control but increasing complexity and error risk. Which language to choose should be based on project requirements and team technology stack.
 Python for Scientific Computing: A Detailed LookApr 19, 2025 am 12:15 AM
Python's applications in scientific computing include data analysis, machine learning, numerical simulation and visualization. 1.Numpy provides efficient multi-dimensional arrays and mathematical functions. 2. SciPy extends Numpy functionality and provides optimization and linear algebra tools. 3. Pandas is used for data processing and analysis. 4.Matplotlib is used to generate various graphs and visual results.
 Python and C : Finding the Right ToolApr 19, 2025 am 12:04 AM
Whether to choose Python or C depends on project requirements: 1) Python is suitable for rapid development, data science, and scripting because of its concise syntax and rich libraries; 2) C is suitable for scenarios that require high performance and underlying control, such as system programming and game development, because of its compilation and manual memory management.
 Python for Data Science and Machine LearningApr 19, 2025 am 12:02 AM
Python is widely used in data science and machine learning, mainly relying on its simplicity and a powerful library ecosystem. 1) Pandas is used for data processing and analysis, 2) Numpy provides efficient numerical calculations, and 3) Scikit-learn is used for machine learning model construction and optimization, these libraries make Python an ideal tool for data science and machine learning.
 Learning Python: Is 2 Hours of Daily Study Sufficient?Apr 18, 2025 am 12:22 AM
Is it enough to learn Python for two hours a day? It depends on your goals and learning methods. 1) Develop a clear learning plan, 2) Select appropriate learning resources and methods, 3) Practice and review and consolidate hands-on practice and review and consolidate, and you can gradually master the basic knowledge and advanced functions of Python during this period.
 Python for Web Development: Key ApplicationsApr 18, 2025 am 12:20 AM
Key applications of Python in web development include the use of Django and Flask frameworks, API development, data analysis and visualization, machine learning and AI, and performance optimization. 1. Django and Flask framework: Django is suitable for rapid development of complex applications, and Flask is suitable for small or highly customized projects. 2. API development: Use Flask or DjangoRESTFramework to build RESTfulAPI. 3. Data analysis and visualization: Use Python to process data and display it through the web interface. 4. Machine Learning and AI: Python is used to build intelligent web applications. 5. Performance optimization: optimized through asynchronous programming, caching and code
 Python vs. C : Exploring Performance and EfficiencyApr 18, 2025 am 12:20 AM
Python is better than C in development efficiency, but C is higher in execution performance. 1. Python's concise syntax and rich libraries improve development efficiency. 2.C's compilation-type characteristics and hardware control improve execution performance. When making a choice, you need to weigh the development speed and execution efficiency based on project needs.


Hot AI Tools

Undresser.AI Undress
AI-powered app for creating realistic nude photos

AI Clothes Remover
Online AI tool for removing clothes from photos.

Undress AI Tool
Undress images for free

Clothoff.io
AI clothes remover

Video Face Swap
Swap faces in any video effortlessly with our completely free AI face swap tool!

Hot Article
Hot Tools

SublimeText3 Chinese version
Chinese version, very easy to use

VSCode Windows 64-bit Download
A free and powerful IDE editor launched by Microsoft

Safe Exam Browser
Safe Exam Browser is a secure browser environment for taking online exams securely. This software turns any computer into a secure workstation. It controls access to any utility and prevents students from using unauthorized resources.

MinGW - Minimalist GNU for Windows
This project is in the process of being migrated to osdn.net/projects/mingw, you can continue to follow us there. MinGW: A native Windows port of the GNU Compiler Collection (GCC), freely distributable import libraries and header files for building native Windows applications; includes extensions to the MSVC runtime to support C99 functionality. All MinGW software can run on 64-bit Windows platforms.

SublimeText3 Mac version
God-level code editing software (SublimeText3)

