Home >Web Front-end >JS Tutorial >Detailed explanation of chrome debugging javascript_javascript skills
Detailed explanation of chrome debugging javascript_javascript skills
- WBOYWBOYWBOYWBOYWBOYWBOYWBOYWBOYWBOYWBOYWBOYWBOYWBOriginal
- 2016-05-16 15:35:562354browse
1. Console API
Console.assert()
Determine whether the first parameter is true. If it is false, an exception will be thrown and the corresponding information will be output to the console.
Console.count()
Record the number of calls using parameters as identification, and print the identification and number of calls on the console when calling.
Console.debug()
An alias for the console.log method. For usage, please refer to Console.log()
Console.dir()
Print a statement starting with a triangle symbol. You can click the triangle to expand to view the properties of the object.
Console.error()
Print an error message. For usage, please refer to string substitution.
Console._exception()
Another name for the error method. For usage, please refer to Console.error()
Console.group()
Print tree structure with groupCollapsed and groupEnd methods;
Console.groupCollapsed()
The usage method is the same as group. The difference is that the content printed by groupCollapsed is collapsed by default.
Console.groupEnd()
End current Tree
Console.info()
Print information starting with an exclamation point character, the usage method is the same as log
Console.log()
Printing a string, the usage method is similar to C’s printf format output
Console.profile()
You can use the first parameter as an identifier to start data collection during the JavaScript execution process. It is similar to opening Profiles in the chrome console option. For details, please refer to chrome profiles
Console.profileEnd()
Cooperate with the profile method as the end of data collection.
Console.table()
Print the data into a table. Console.table [en-US]
Console.time()
Timer, accepts a parameter as an identifier.
Console.timeEnd()
Accepts a parameter as a flag to end a specific timer.
Console.trace()
Print stack trace.
Console.warn()
Print a warning message. For usage, please refer to string substitution.
2. Usage
1. Console.log
Old version compatible
if(!window.console){ window.console = {log: function(){} }; }
Output object
var someObject = { str: "Some text", id: 5 };
console.log(someObject);
//Object {str: "Some text", id: 5}
Formatting
%s format string
%d or %i format int
%f format float
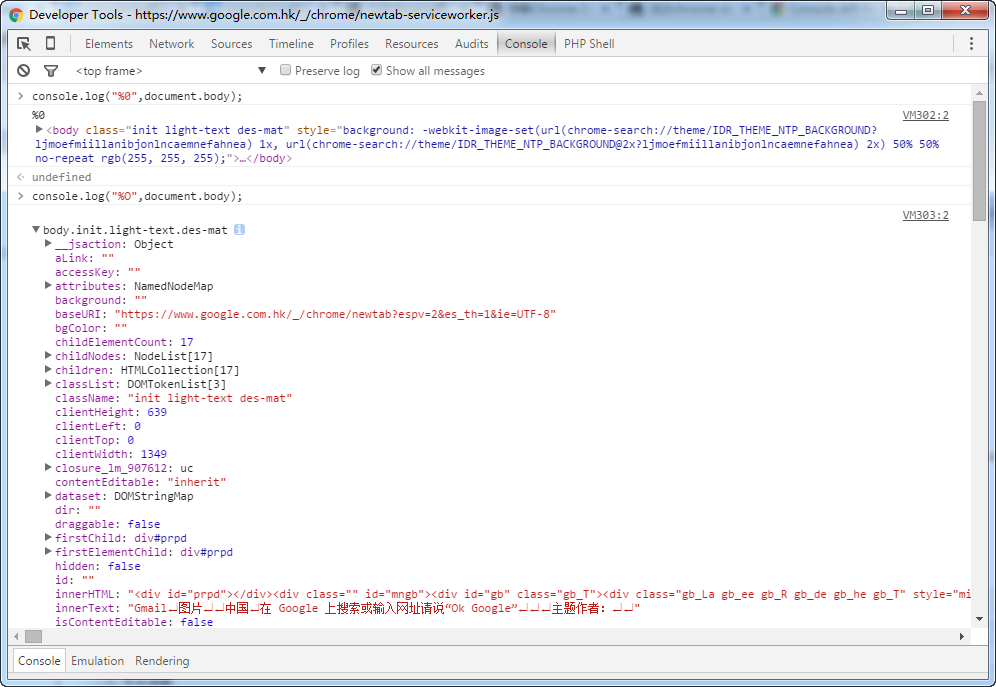
%o Format Object object
%O format object object
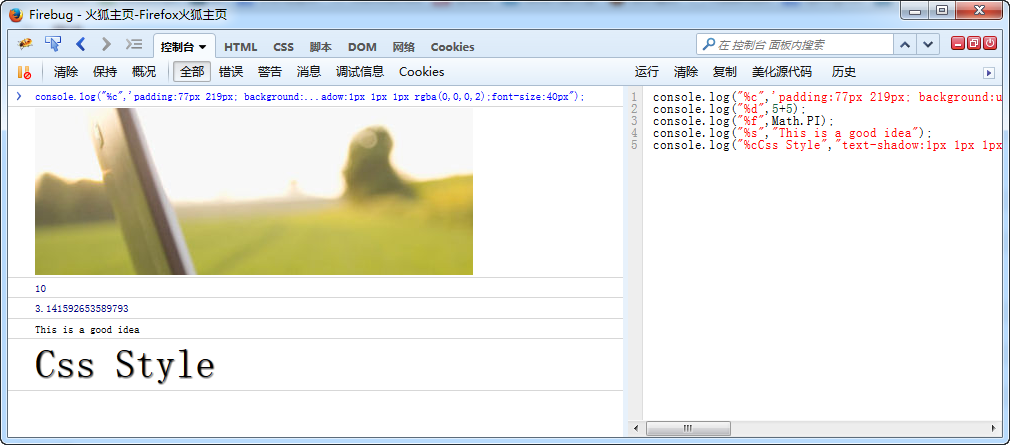
%c format css
Output object
console.log("%o",document.body);
console.log("%O",document.body);

console.log("%c",'padding:77px 219px; background:url(http://www.erongtu.com/application/uploads/ask/2015-10-20/5625a690f0ddd.jpg) no-repeat;line-height:166px;height:166px;');
console.log("%d",5+5);
console.log("%f",Math.PI);
console.log("%s","This is a good idea");
console.log("%cCss Style","text-shadow:1px 1px 1px rgba(0,0,0,2);font-size:40px");
Google chrome 46.0.2490.71 m 上图片出不来

Firefox 41.0.2 下测试

不过网上有一个有趣的东西 console.image,chrome自带的有扩展 https://github.com/jffry/console.image-chrome-extension
console.image("http://i.imgur.com/hv6pwkb.png");
console.image("http://i.imgur.com/hv6pwkb.png");
console.image("http://i.imgur.com/hv6pwkb.png");
console.image("http://i.imgur.com/hv6pwkb.png");
源代码地址:https://github.com/adriancooney/console.image
2、console.info/console.log
var car = "Dodge Charger";
var someObject = {str:"Some text", id:5};
console.info("My first car was a", car, ". The object is: ", someObject);
for (var i=0; ic66f9694236d48fa2f8b6ce452422dbb Web Developer > Error Console), but Firebug is much better; use Firebug)
Safari and Chrome
Basically the same.
https://developer.chrome.com/devtools/index
https://developer.apple.com/technologies/safari/developer-tools.html
Internet Explorer
Don't forget you can use compatibility modes to debug IE7 and IE8 in IE9 or IE10
http://msdn.microsoft.com/en-us/library/ie/gg589507(v=vs.85).aspx
http://msdn.microsoft.com/en-us/library/dd565628(v=vs.85).aspx
If you must access the console in IE6 for IE7 use the Firebug Lite bookmarklet
http://getfirebug.com/firebuglite/ look for stable bookmarklet
http://en.wikipedia.org/wiki/Bookmarklet
Opera
http://www.opera.com/dragonfly/
iOS
Works for all iPhones, iPod touch and iPads.
http://developer.apple.com/library/ios/ipad/#DOCUMENTATION/AppleApplications/Reference/SafariWebContent/DebuggingSafarioniPhoneContent/DebuggingSafarioniPhoneContent.html
Now with iOS 6 you can view the console through Safari in OS X if you plug in your device. Or you can do so with the emulator, simply open a Safari browser window and go to the "Develop" tab. There you will find options to get the Safari inspector to communicate with your device.
Windows Phone, Android
Both of these have no console built in and no bookmarklet ability. So we use http://jsconsole.com/type :listen and it will give you a script tag to place in your HTML. From then on you can view your console inside the jsconsole website.
iOS and Android
You can also use http://html.adobe.com/edge/inspect/ to access web inspector tools and the console on any device using their convenient browser plugin.
Older browser problems
Lastly older browsers (thanks again Microsoft) will crash if you use console.log in your code and not have the developer tools open at the same time. Luckily its an easy fix. Simple use the below code snippet at the top of your code and good old IE should leave you alone:
if(!window.console){ window.console = {log: function(){} }; }
This checks to see if the console is present, and if not it sets it to an object with a blank function calledlog. This way window.console and window.console.log is never truly undefined.
http://stackoverflow.com/questions/4539253/what-is-console-log
https://developer.chrome.com/devtools/docs/console-api#consolelogobject-object
https://developers.google.com/chrome-developer-tools/docs/console-api
http://getfirebug.com/wiki/index.php/Console_API
https://developer.chrome.com/devtools/docs/console-api
https://developer.apple.com/library/safari/documentation/AppleApplications/Conceptual/Safari_Developer_Guide/Console/Console.html
https://developer.mozilla.org/zh-CN/docs/Web/API/Console
Related articles
See more- An in-depth analysis of the Bootstrap list group component
- Detailed explanation of JavaScript function currying
- Complete example of JS password generation and strength detection (with demo source code download)
- Angularjs integrates WeChat UI (weui)
- How to quickly switch between Traditional Chinese and Simplified Chinese with JavaScript and the trick for websites to support switching between Simplified and Traditional Chinese_javascript skills

