Home >Backend Development >PHP Tutorial >Configuration of PHP jpgraph library and generation of various statistical charts
Configuration of PHP jpgraph library and generation of various statistical charts
- coldplay.xixiforward
- 2020-08-04 15:57:122881browse

JpGraph Introduction
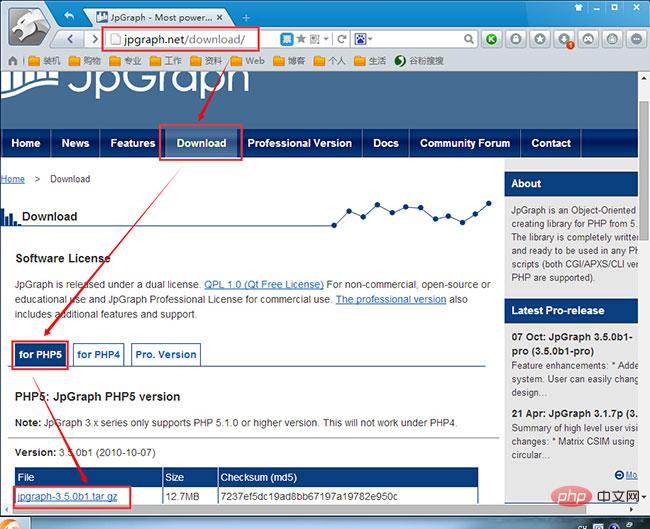
JpGraph is an open source PHP statistical chart generation library, built based on PHP's GD2 graphics library. Encapsulates the related operations of generating statistical charts and hides some complex operations, making it easier to output statistical charts on the PHP page. The official website of JpGraph is: http://jpgraph.net, where developers can download the latest version of JpGraph for free and read related help documents or sample programs.
Related learning recommendations: PHP programming from entry to proficiency
JpGraph configuration
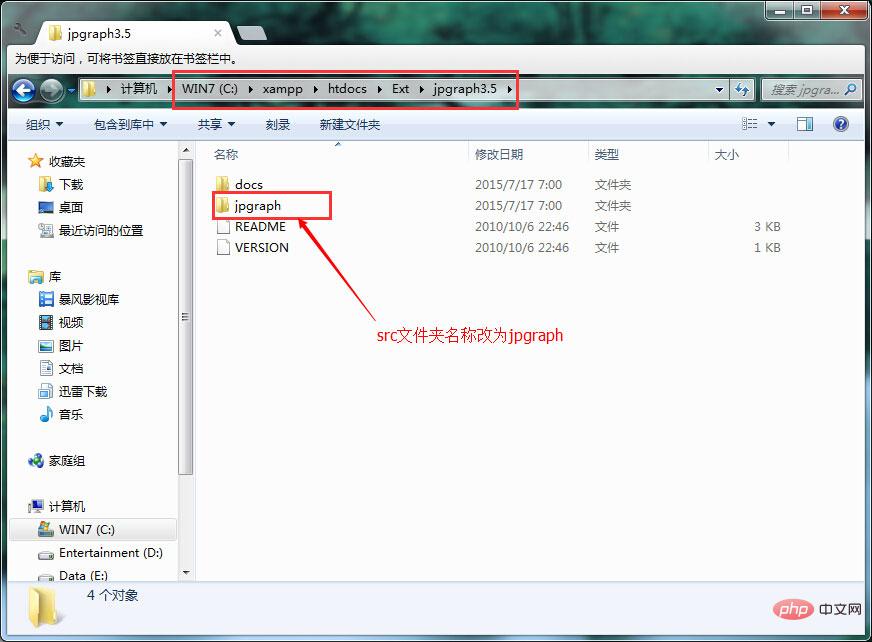
(1) Modify the file php.ini
Add the directory path of jpgraph in include_path, and decompress the src of jpgraph The directory name is changed to jpgraph.

(2) Check whether PHP supports the GD library
Find the statement;extension=php_gd2.dll in the php.ini file. Remove the ; sign before the above statement, that is, remove the comment. If you cannot find this statement because of different PHP versions, you can directly add extension=php_gd2.dll
(3) Modify the file jpgraph_gb2312.php
Find the function: function gb2utf8($gb)
Change the function to:
  function gb2utf8($gb) {
  return $gb;
  }
That is, the code that does not use gb2 encoding to convert to utf8.

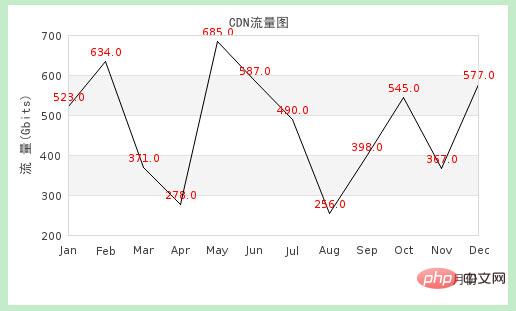
Line chart
<?php
require_once ("jpgraph/jpgraph.php");
require_once ("jpgraph/jpgraph_line.php");

$data1 = array(523,634,371,278,685,587,490,256,398,545,367,577); //第一条曲线的数组

$graph = new Graph(500,300);
$graph->SetScale("textlin");
$graph->SetShadow();
$graph->img->SetMargin(60,30,30,70); //设置图像边距

$graph->graph_theme = null; //设置主题为null,否则value->Show(); 无效

$lineplot1=new LinePlot($data1); //创建设置两条曲线对象
$lineplot1->value->SetColor("red");
$lineplot1->value->Show();
$graph->Add($lineplot1); //将曲线放置到图像上

$graph->title->Set("CDN流量图");  //设置图像标题
$graph->xaxis->title->Set("月份"); //设置坐标轴名称
$graph->yaxis->title->Set("流 量(Gbits)");
$graph->title->SetMargin(10);
$graph->xaxis->title->SetMargin(10);
$graph->yaxis->title->SetMargin(10);

$graph->title->SetFont(FF_SIMSUN,FS_BOLD); //设置字体
$graph->yaxis->title->SetFont(FF_SIMSUN,FS_BOLD);
$graph->xaxis->title->SetFont(FF_SIMSUN,FS_BOLD);
$graph->xaxis->SetTickLabels($gDateLocale->GetShortMonth());
$graph->Stroke(); //输出图像
?>
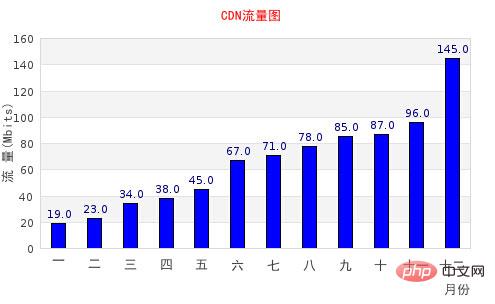
Barchart
<?php
require_once ("jpgraph/jpgraph.php");
require_once ("jpgraph/jpgraph_bar.php");
$data = array(19,23,34,38,45,67,71,78,85,87,96,145);
$ydata = array("一","二","三","四","五","六","七","八","九","十","十一","十二");
$graph = new Graph(500,300); //创建新的Graph对象
$graph->SetScale("textlin"); //刻度样式
$graph->SetShadow(); //设置阴影
$graph->img->SetMargin(40,30,40,50); //设置边距
$graph->graph_theme = null; //设置主题为null,否则value->Show(); 无效
$barplot = new BarPlot($data); //创建BarPlot对象
$barplot->SetFillColor('blue'); //设置颜色
$barplot->value->Show(); //设置显示数字
$graph->Add($barplot); //将柱形图添加到图像中
$graph->title->Set("CDN流量图");
$graph->xaxis->title->Set("月份"); //设置标题和X-Y轴标题
$graph->yaxis->title->Set("流 量(Mbits)");
$graph->title->SetColor("red");
$graph->title->SetMargin(10);
$graph->xaxis->title->SetMargin(5);
$graph->xaxis->SetTickLabels($ydata);
$graph->title->SetFont(FF_SIMSUN,FS_BOLD); //设置字体
$graph->yaxis->title->SetFont(FF_SIMSUN,FS_BOLD);
$graph->xaxis->title->SetFont(FF_SIMSUN,FS_BOLD);
$graph->xaxis->SetFont(FF_SIMSUN,FS_BOLD);
$graph->Stroke();
?>
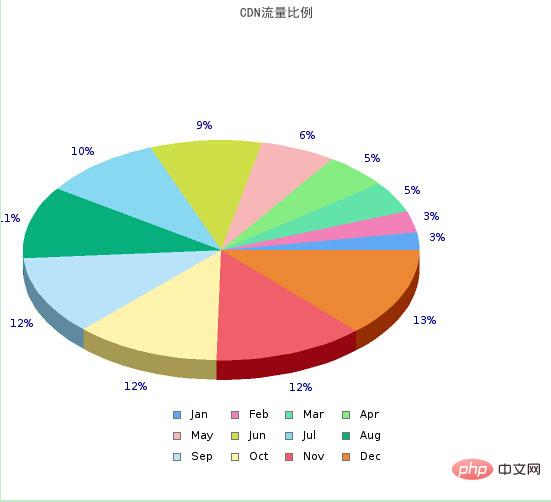
pie chart
<?php
require_once ("jpgraph/jpgraph.php");
require_once ("jpgraph/jpgraph_pie.php");
require_once ("jpgraph/jpgraph_pie3d.php");

$data = array(19,23,34,38,45,67,71,78,85,87,90,96);

$graph = new PieGraph(550,500);
$graph->SetShadow();

$graph->title->Set("CDN流量比例");
$graph->title->SetFont(FF_SIMSUN,FS_BOLD);

$pieplot = new PiePlot3D($data); //创建PiePlot3D对象
$pieplot->SetCenter(0.4, 0.5); //设置饼图中心的位置
$pieplot->SetLegends($gDateLocale->GetShortMonth()); //设置图例
$graph->Add($pieplot);
$graph->Stroke();
?>
The above is the detailed content of Configuration of PHP jpgraph library and generation of various statistical charts. For more information, please follow other related articles on the PHP Chinese website!

