
Home >Backend Development >PHP Tutorial >PHP uses Jpgraph to create a 3D pie chart effect example
PHP uses Jpgraph to create a 3D pie chart effect example
- 墨辰丷Original
- 2018-05-25 14:29:121756browse
This article mainly introduces the effect of php using Jpgraph to create a 3D pie chart. It analyzes the principles, implementation steps and related operating techniques of php based on Jpgraph in the form of examples. Friends in need can refer to it
The example in this article describes how PHP uses Jpgraph to create a 3D pie chart effect. Share it with everyone for your reference, the details are as follows:
The function of using the Jpgraph class library to create statistical charts is extremely powerful. It can not only draw flat graphics, but also graphics with 3D effects. You can directly use the GD2 function library to draw various graphics, including 3D pie charts of course. However, using the GD2 function to draw 3D graphics takes a lot of time and is relatively complicated. However, using the Jpgraph class library to draw 3D pie charts is very convenient and fast. .
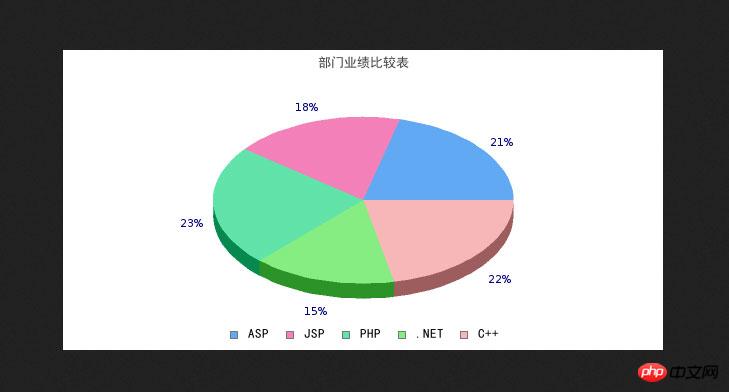
Example: Use Jpgraph to create a 3D pie chart to compare department performance.
The specific steps are as follows:
(1) Import the Jpgraph class library and pie chart drawing function into the program.
require_once 'jpgraph/src/jpgraph.php'; //导入Jpgraph类库
require_once 'jpgraph/src/jpgraph_pie.php'; //导入Jpgraph类库的饼形图功能
require_once 'jpgraph/src/jpgraph_pie3d.php'; //导入Jpgraph类库的3D饼形图功能
(2) Create a numerical array as statistical data
$data = array(89, 78, 99, 65, 92); //设置统计数据
(3 ) Create a statistical chart object and set the title content and font of the statistical chart.
$graph = new PieGraph(600, 300);
$graph->SetShadow();
$graph->title->Set(iconv('utf-8', 'GB2312//IGNORE', '部门业绩比较表'));
$graph->title->SetFont(FF_SIMSUN, FS_BOLD);
(4) Create a 3D pie chart object and enter the statistical chart
$pieplot = new PiePlot3D($data); //创建3D饼图对象
$pieplot->SetCenter(0.5, 0.5);
$department = array('ASP', 'JSP', 'PHP', '.NET', 'C++'); //设置文字框对应的内容
$pieplot->SetLegends($department);
$graph->legend->SetFont(FF_SIMSUN, FS_BOLD); //设置字体
$graph->legend->SetLayout(LEGEND_HOR);
$graph->legend->Pos(0.5, 0.98, 'center', 'bottom'); //图例文字框的位置
$graph->Add($pieplot); //将3D饼图添加到统计图对象中
$graph->Stroke(); //输出图像
The running results are as follows:
php graphicsjpgraphOperation analysis
jpgraphBar graph example code
The above is the detailed content of PHP uses Jpgraph to create a 3D pie chart effect example. For more information, please follow other related articles on the PHP Chinese website!