


<p id="myChart" : style="max-width:90%"></p>
<script> export default {
mounted(){
this.drawLine();
},
methods: {
drawLine(){
var myChartContainer = document.getElementById('myChart'); //用于使chart自适应宽度,通过窗体宽计算容器高宽
var resizeMyChartContainer = function(){
myChartContainer.style.width=(document.body.clientWidth-75)+'px'
} //设置容器高宽
resizeMyChartContainer()
// 基于准备好的dom,初始化echarts实例
var myChart = this.$echarts.init(myChartContainer)
// 绘制图表
myChart.setOption({
title: { text: '启动次数' },
tooltip: {},
xAxis: {
type: 'category',
data: ['2019-02-15', '2019-02-16', '2019-02-17', '2019-02-18', '2019-02-19', '2019-02-20', '2019-02-21']
},
yAxis: {
type:'value'
},
series: [{
type: 'line',
data: [0,0, 0, 7, 0, 0,12],
smooth:true,
symbol: 'circle',
symbolSize: 6,
itemStyle:{
normal:{
color:'#fc8a0f',
lineStyle:{
color:'#ff9c35'
}
}
}
}],
});
window.onresize=function(){
resizeMyChartContainer();
myChart.resize();
}
}
}}</script>Supplementary knowledge: echarts chart size changes adaptively as the window changes (No need to refresh the browser to adjust)
Question:
After using echars to make charts, you need to make adaptive effects according to the zoom of the browser window.
Cause analysis and solution:
The icon instance of echars does not actually actively bind the resize() event , which means that the size change of the display area is not known internally. When you need to do some adaptive effects, you need to actively bind this time to achieve the effect of self-use. Common ones are window.onresize = myChart.resize( )
Example:
var map5 = echarts.init(document.getElementById('map5'));
var option5 = {
backgroundColor: '#def1f9',
color: ['#c23531', '#1875ff'],
title: {
left: 10,
top: 10,
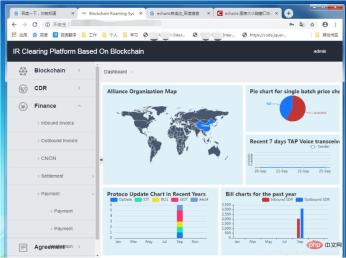
text: 'Bill charts for the past year'
},
// color: ['#1875ff', '#1fe6ab', '#eee119', '#ff3074', '#6f99d9'],
legend: {
top: 30,
right: 30
},
tooltip: {},
xAxis: {type: 'category'},
yAxis: {},
series: [
{type: 'bar'},
{type: 'bar'}
]
}
map5.setOption(option5);
window.onresize = function () {
setTimeout(function () {
map1.resize()
map2.resize()
map3.resize()
map4.resize()
map5.resize()
},10)
}Key points:
window.onresize = function () {
   map1.resize() ; // 如果有多个图标变动,可写多个
}
Recommended tutorial:《 JS tutorial》
The above is the detailed content of Implement Echarts in Vue to change with the form. For more information, please follow other related articles on the PHP Chinese website!

 From Websites to Apps: The Diverse Applications of JavaScriptApr 22, 2025 am 12:02 AM
JavaScript is widely used in websites, mobile applications, desktop applications and server-side programming. 1) In website development, JavaScript operates DOM together with HTML and CSS to achieve dynamic effects and supports frameworks such as jQuery and React. 2) Through ReactNative and Ionic, JavaScript is used to develop cross-platform mobile applications. 3) The Electron framework enables JavaScript to build desktop applications. 4) Node.js allows JavaScript to run on the server side and supports high concurrent requests.
 Python vs. JavaScript: Use Cases and Applications ComparedApr 21, 2025 am 12:01 AM
Python is more suitable for data science and automation, while JavaScript is more suitable for front-end and full-stack development. 1. Python performs well in data science and machine learning, using libraries such as NumPy and Pandas for data processing and modeling. 2. Python is concise and efficient in automation and scripting. 3. JavaScript is indispensable in front-end development and is used to build dynamic web pages and single-page applications. 4. JavaScript plays a role in back-end development through Node.js and supports full-stack development.
 The Role of C/C in JavaScript Interpreters and CompilersApr 20, 2025 am 12:01 AM
C and C play a vital role in the JavaScript engine, mainly used to implement interpreters and JIT compilers. 1) C is used to parse JavaScript source code and generate an abstract syntax tree. 2) C is responsible for generating and executing bytecode. 3) C implements the JIT compiler, optimizes and compiles hot-spot code at runtime, and significantly improves the execution efficiency of JavaScript.
 JavaScript in Action: Real-World Examples and ProjectsApr 19, 2025 am 12:13 AM
JavaScript's application in the real world includes front-end and back-end development. 1) Display front-end applications by building a TODO list application, involving DOM operations and event processing. 2) Build RESTfulAPI through Node.js and Express to demonstrate back-end applications.
 JavaScript and the Web: Core Functionality and Use CasesApr 18, 2025 am 12:19 AM
The main uses of JavaScript in web development include client interaction, form verification and asynchronous communication. 1) Dynamic content update and user interaction through DOM operations; 2) Client verification is carried out before the user submits data to improve the user experience; 3) Refreshless communication with the server is achieved through AJAX technology.
 Understanding the JavaScript Engine: Implementation DetailsApr 17, 2025 am 12:05 AM
Understanding how JavaScript engine works internally is important to developers because it helps write more efficient code and understand performance bottlenecks and optimization strategies. 1) The engine's workflow includes three stages: parsing, compiling and execution; 2) During the execution process, the engine will perform dynamic optimization, such as inline cache and hidden classes; 3) Best practices include avoiding global variables, optimizing loops, using const and lets, and avoiding excessive use of closures.
 Python vs. JavaScript: The Learning Curve and Ease of UseApr 16, 2025 am 12:12 AM
Python is more suitable for beginners, with a smooth learning curve and concise syntax; JavaScript is suitable for front-end development, with a steep learning curve and flexible syntax. 1. Python syntax is intuitive and suitable for data science and back-end development. 2. JavaScript is flexible and widely used in front-end and server-side programming.
 Python vs. JavaScript: Community, Libraries, and ResourcesApr 15, 2025 am 12:16 AM
Python and JavaScript have their own advantages and disadvantages in terms of community, libraries and resources. 1) The Python community is friendly and suitable for beginners, but the front-end development resources are not as rich as JavaScript. 2) Python is powerful in data science and machine learning libraries, while JavaScript is better in front-end development libraries and frameworks. 3) Both have rich learning resources, but Python is suitable for starting with official documents, while JavaScript is better with MDNWebDocs. The choice should be based on project needs and personal interests.


Hot AI Tools

Undresser.AI Undress
AI-powered app for creating realistic nude photos

AI Clothes Remover
Online AI tool for removing clothes from photos.

Undress AI Tool
Undress images for free

Clothoff.io
AI clothes remover

Video Face Swap
Swap faces in any video effortlessly with our completely free AI face swap tool!

Hot Article
Hot Tools

Dreamweaver CS6
Visual web development tools

SAP NetWeaver Server Adapter for Eclipse
Integrate Eclipse with SAP NetWeaver application server.

MantisBT
Mantis is an easy-to-deploy web-based defect tracking tool designed to aid in product defect tracking. It requires PHP, MySQL and a web server. Check out our demo and hosting services.

Zend Studio 13.0.1
Powerful PHP integrated development environment

PhpStorm Mac version
The latest (2018.2.1) professional PHP integrated development tool

