Home >Common Problem >What is in situ visualization
What is in situ visualization
- (*-*)浩Original
- 2019-11-16 13:43:163958browse

Programmers need to write, test, debug, and review code during the software development process. To ensure the correctness of the code, programmers must combine the code with the runtime state of the program. (Recommended learning: web front-end video tutorial)
But existing technologies, including debugging logs, setting breakpoints, etc., are in different views from the code. Programmers are debugging the program. It is necessary to frequently switch the line of sight, which puts a great burden on programmers and reduces their debugging efficiency. This article proposes the technology of putting visualization directly into the source code to help programmers understand the program.

This work is mainly driven by two related work: program visualization and debugging, and text and environment enhancement.
Regarding program visualization and debugging, the Python online tutoring system visualizes variables, objects, and stack frame structures while the Python program is running. Users can check the status of their programs while they are running. Regarding text and environmental enhancement, Pascal Goffin explores various word-sized graphics embedded in text.
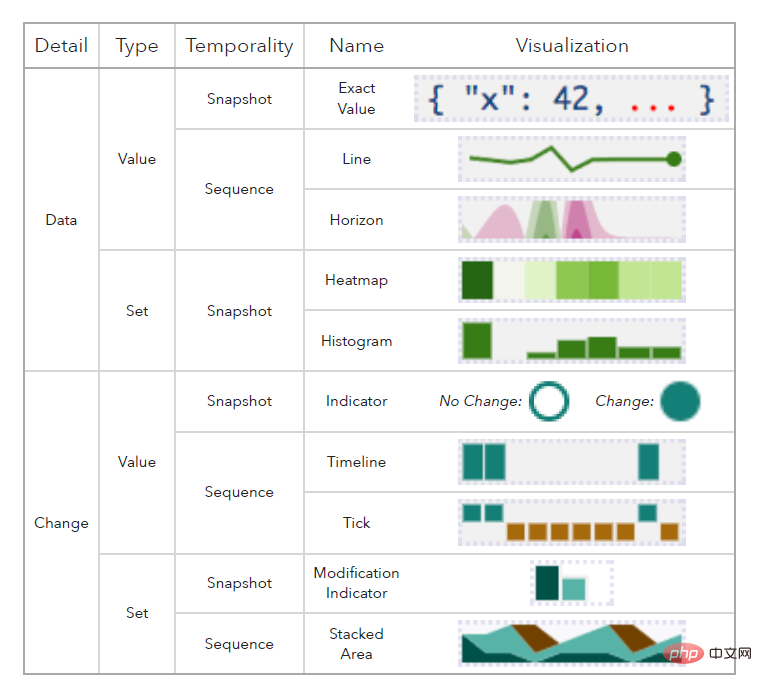
The following picture is the specific visual design of this work:

This work is based on the details A total of 10 visual symbols are designed based on different levels (specific data/whether data changes), data variable types (values/sets), and temporal levels (snapshots/time series).
For example, users can observe changes in values over time through a line chart or horizon chart. When the mouse is hovering over the line chart, the user can see the current value of the variable. Users can also use the area chart to observe the increase, decrease, and change of elements in the collection over time.
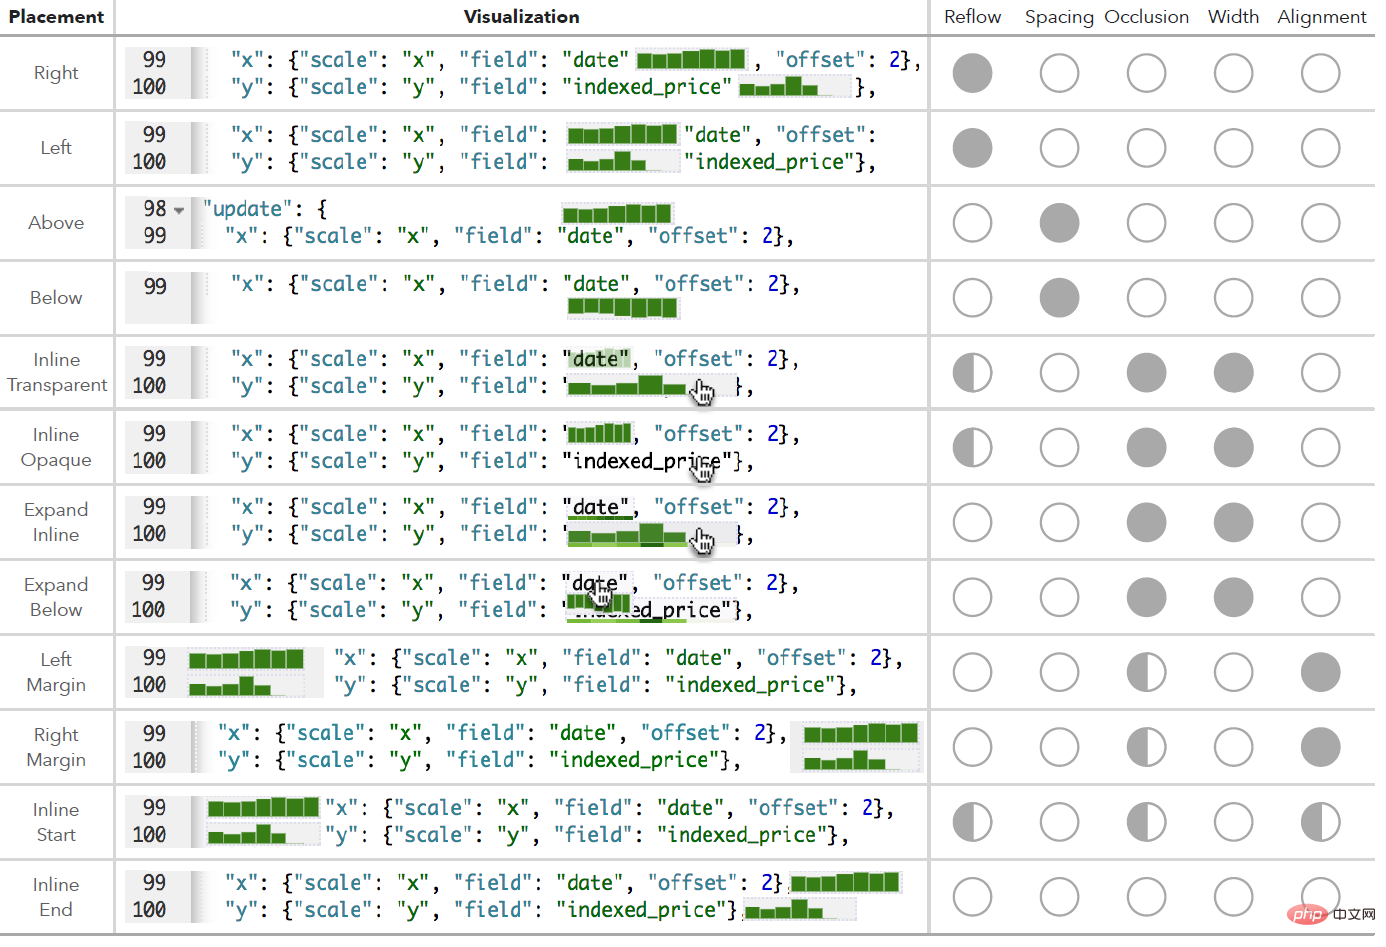
 As shown in the picture above, this work also considers the advantages and disadvantages of different placement locations.
For example, placing the code immediately to the left and right of lines 1 and 2 will affect the length of this line of code; placing it above and below the code in lines 3 and 4 will not affect the length of this line of code, but it will It takes up an extra line of space, thereby increasing the overall length of the code;
Lines 5-8 are displayed by mouse hovering. Although it basically does not affect the length of the code, the visual symbols will cover part of the code, and require Symbols are variable-length; lines 9-12 are placed at the beginning and end of the line. Although it seems to have little impact, it cannot cope well with situations where a lot of data needs to be visualized in one line. All in all, each of the methods mentioned above has its pros and cons.
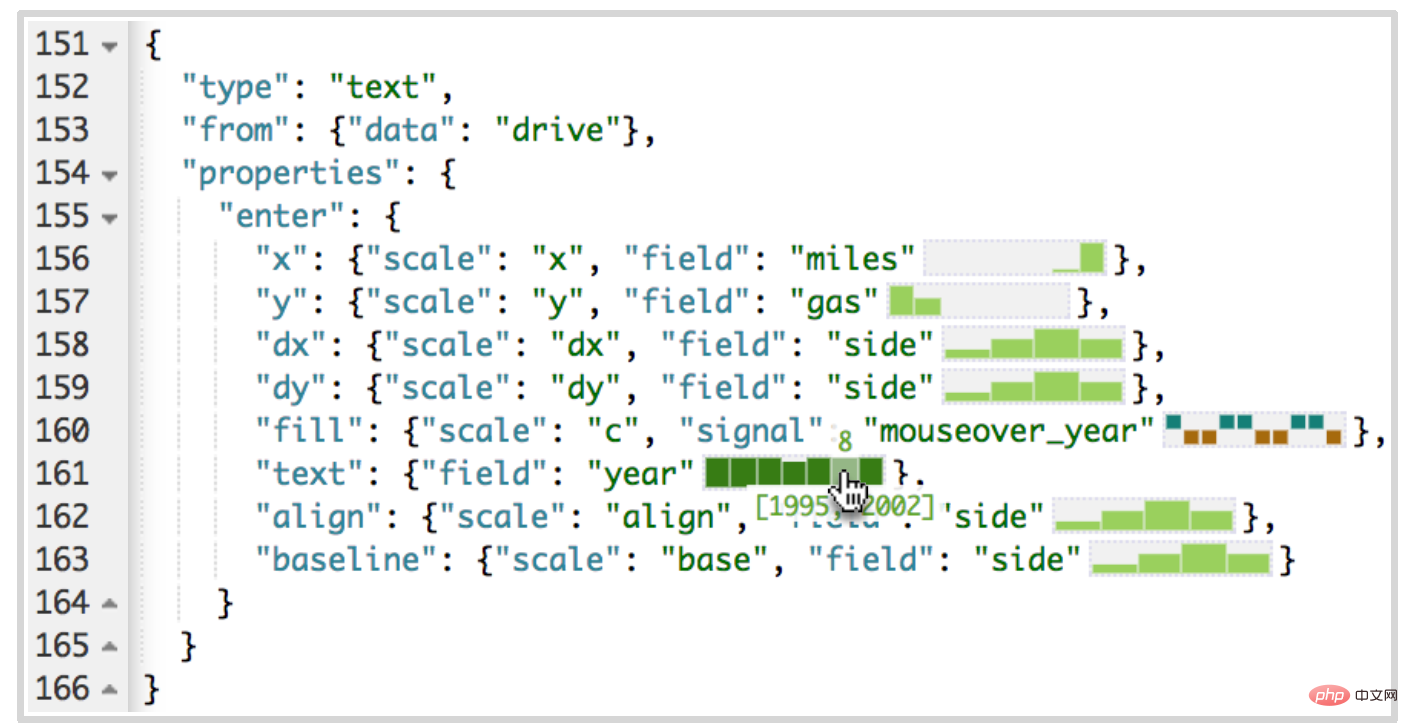
In the case analysis, this work uses D3.js to implement the enhancement of the Vega language editor. First, the Monaco API [4] is used to extract tokens from the Vega language code, and then five visual symbols are implemented for numerical variables and set variables, which are placed immediately to the right of the variables.
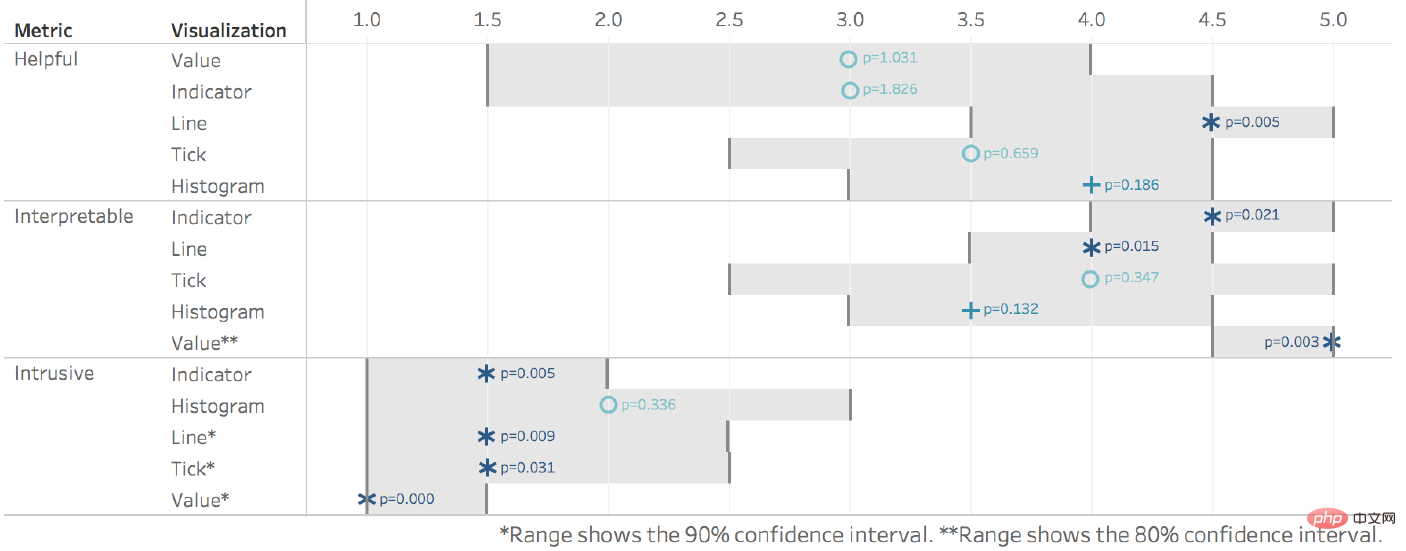
The author recruited 18 Vega beginners for testing. Each tester successively read the original Vega code and the visualized Vega code (probability balanced), and then answered questions about the code.
According to statistics, testers generally scored higher when reading visual code, and testers believed that this visual design was "helpful, explanatory, and less disruptive to reading."
 In general, this work proposes a method of enhancing code through in-situ visualization to help users understand the status of the program when it is running, and the design is implemented on the Vega language editor.
The above is the detailed content of What is in situ visualization. For more information, please follow other related articles on the PHP Chinese website!

