Home >Backend Development >PHP Problem >How to debug php programs generally
How to debug php programs generally
- 藏色散人Original
- 2019-10-02 13:26:274832browse

How to debug php programs in general?
Generally use Xdebug. Xdebug is an open source PHP program debugger (i.e. a Debug tool) that can be used to track, debug and analyze the running status of PHP programs.
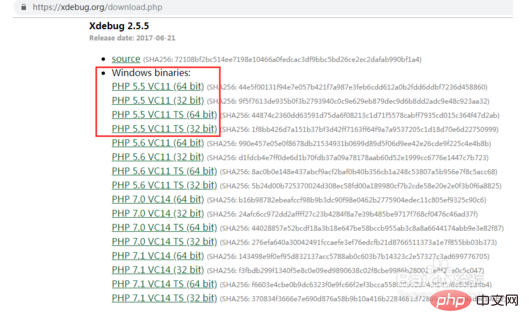
First step, download xdebug
There are two versions with Non-thread-safe and without Non-thread-safe, the abbreviation (ts) is mainly It depends on whether your php version is thread-safe.
Then copy the downloaded dll to the ext folder in php (the extension dlls are all here), and rename it to php_xdebug.dll
The editor uses Windows7 apache mysql PHP5.5 you Just find the corresponding version and download it.
The second step is to configure xdebug
Modify php.ini and add the following configuration information.

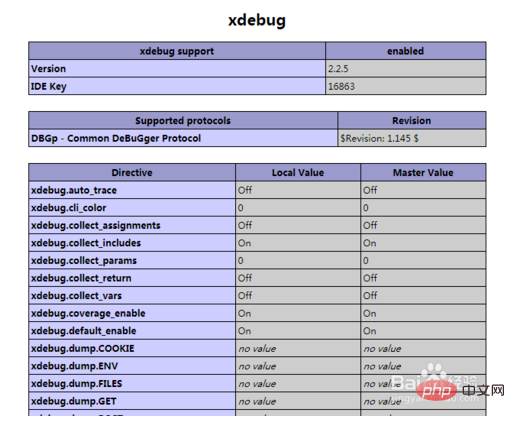
The third step, phpinfo() checks whether xdebug is configured successfully
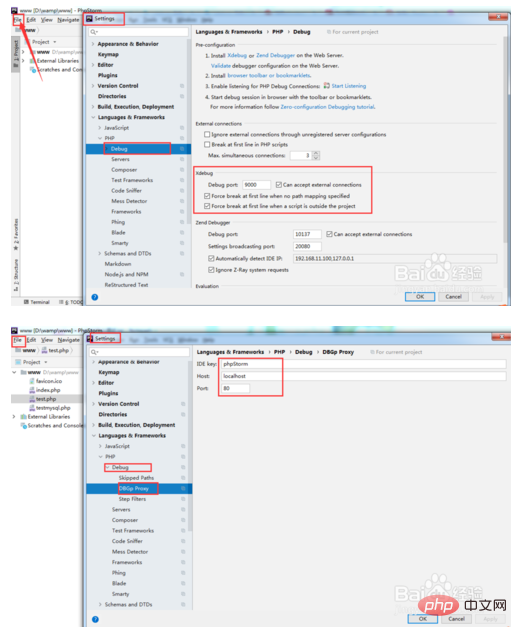
The fourth step, configure phpstorm2018, find Can't search in the search box.
Figure ① By default, the IDE will listen to port 9000 on this machine.
Figure ② Configure phpstorm and bind xdebug.
Figure ③ Configure phpstorm’s xdebug server.
Figure ④ Configuring phpstorm requires the xdebug running file.
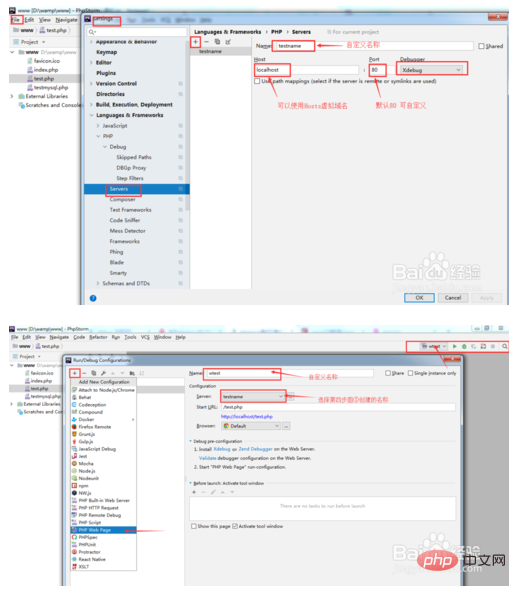
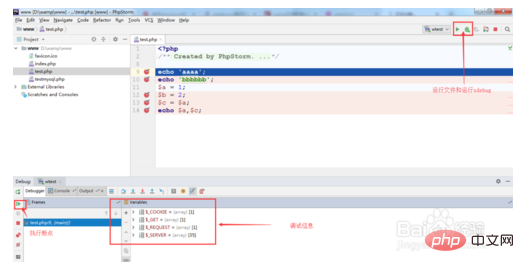
The fifth step is to run the file for xdebug to achieve debugging.
Note
It is best not to set the Host to an IP such as 127.0.0.1, as it may not be able to bind to Cause Waiting for incoming connection with ide key XX! ! !
The above are the details of using phpstorm for PHP breakpoint debugging.
For more PHP related knowledge, please visit PHP Chinese website!
The above is the detailed content of How to debug php programs generally. For more information, please follow other related articles on the PHP Chinese website!

