Home >Development Tools >phpstorm >How to debug php web project with phpstorm
How to debug php web project with phpstorm
- 爱喝马黛茶的安东尼Original
- 2019-08-19 10:50:4511159browse

Xdebug configuration
In the Web application running environment, open the php.ini file (for example, your Web program If it runs locally, modify the local php.ini. If your program runs on the intranet machine 172.16.17.8, then you can ssh to this machine and modify the php.ini of this machine). Add Xdebug configuration at the end of the file:
[Xdebug]
xdebug.remote_enable=1
xdebug.remote_host=127.0.0.1
xdebug.remote_connect_back=1
xdebug.remote_port=9001
xdebug.remote_autostart=1
xdebug.idekey=phpstorm
The most commonly used configurations are the above. The configurations of these are explained as follows:
·remote_enable
Determine whether xdebug turns on remote debugging mode, which must be turned on when using Remote Debugging;
·remote_host vs remote_connect_back
Since these two configuration items have They are closely related, so we talk about them together.
(1) First of all, if you are targeting a single debugging user, such as debugging yourself, you can set remote_host to the IP where your web program is running, and the value of remote_connect_back is not set or set to 0 (you The default is 0 if not set). In this way, Xdebug will always connect to the IP specified by remote_host every time it is debugged;
(2) But if you support multi-person debugging, there is obviously no way to set a remote_host. At this time, you can use remote_connect_back=1 to set it. When remote_connect_back is set to 1, xdebug will automatically connect back according to the requested IP for debugging, thus supporting multi-person debugging. At the same time, setting this value to 1 will invalidate the remote_host setting;
(3) Under normal circumstances, it is recommended to use the configuration of remote_connect_back=1
·remote_port
Obviously this is to set the debugging port. The port here needs to be consistent with the debugging port configured in PHPStorm. It needs to be noted that if it is not available, it will conflict with other ports, otherwise you will not be able to enter debugging. We set it to 9001 here. (Because the default port of fpm is 9000, in order to prevent conflicts, it is set to 9001 here);
·remote_autostart
By default, triggering debugging needs to be added to the url get parameter: XDEBUG_SESSION_START={xdebug.idekey}, if you want to automatically start debugging, you can set this value to 1, so it is recommended to set this value to 1;
# can be understood as a debugging token. The token configured in PHP running the web program needs to be consistent with the token configured in PHPStorm to trigger debugging;Related recommendations: " PhpStorm usage tutorial
》After the configuration is completed, don’t forget to restart fpm, and then print phpinfo (enter phpinfo();exit; at the entrance of the Web program, and then access the Web program to view the php Configuration related information) to check whether the configuration is effective;1. Check whether Xdebug is installed and version information
2. Check xdebug parameter information (Ctrl f search xdebug)
Open PHPStorm, click the menu PhpStorm->Preferences to enter the configuration dialog box. Click Languages & Frameworks -> PHP -> Xdebug, enter the Debug configuration page, set the Debug Port under Xdebug to 9001, and then click OK:
Set it here Now, you can test it:
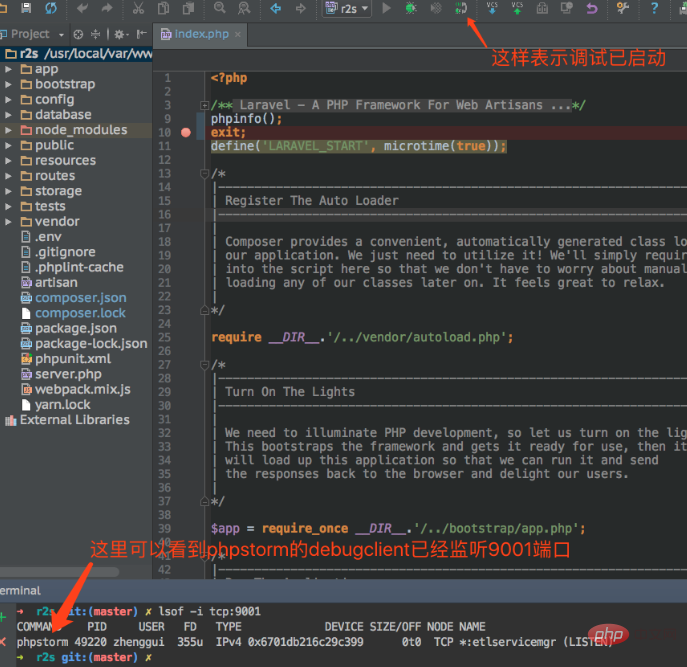
Click the remote debugging button on the toolbar:
Use the lsof -i tcp:9001 command to check whether the debugging Client of PHPStorm is Start:
Configure PHP Server. PhpStorm->Preferences -> Languages & Frameworks -> PHP -> Servers, click , and enter the domain name and port of the Web program on the right. Depending on whether it is remote debugging, configure Use, and click OK after configuring. Pay special attention to Use Path Mappings:
If you are debugging a local Web program, no setting is required here; 
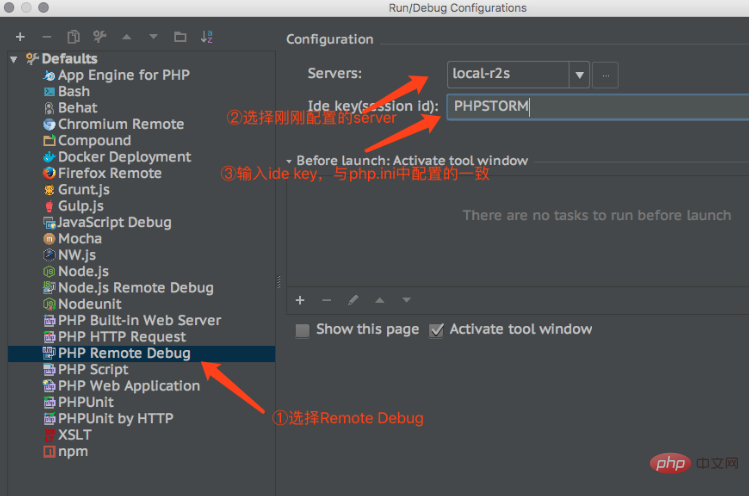
Configure Remote Debug. Enter the configuration window of the running environment from the menu bar Run->Edit Configuations, click on the number in the upper left corner of the window, select PHP Remote Debug, select the local-r2s we just configured in Servers on the right, and then enter the ide key (PHPSTORM ), click OK.

At this point, the debugging configuration is completed.
Now turn on the remote debugging button on the toolbar (if you turned it on when testing before, click it to turn it off, and click it again to turn it on). Then set breakpoints in the code. If there are no accidents, you can enter the breakpoint.
The above is the detailed content of How to debug php web project with phpstorm. For more information, please follow other related articles on the PHP Chinese website!


