Home >Development Tools >phpstorm >How to configure phpstorm to xampp
How to configure phpstorm to xampp
- 爱喝马黛茶的安东尼Original
- 2019-08-19 13:34:064966browse
Need to prepare:
·phpstorm 8.0.1
##·xampp5.6.8
·chrome browser
Since xampp integrates mysql, apache, xdebug and php, there is no need to download it separately.Steps:
1. Install xampp2. Open the xampp folder, find the php.ini file in the php folder, and open it with notepad After that, you can see the following code in the file[XDebug] ;zend_extension = "D:\xampp\php\ext\php_xdebug.dll" ;xdebug.profiler_append = 1 ;xdebug.profiler_enable = 1 ;xdebug.profiler_enable_trigger = 1 ;xdebug.profiler_output_dir = "D:\xampp\tmp" ;xdebug.profiler_output_name = "cachegrind.out.%t-%s" ;xdebug.var_display_max_data=4056 ;xdebug.var_display_max_depth=5 ;xdebug.remote_enable = 1We need to remove the ";" in the code and then add the following code:
xdebug.remote_handler = dbgp
xdebug.remote_host = 127.0.0.1
xdebug.remote_autostart=1
xdebug.trace_output_dir = "D:\xampp\tmp"
xdebug.remote_port=9000
xdebug.idekey="PHPSTORM"
After saving the file, we need to check whether xdebug is successfully installed. . There are two methods below: (1) Open xampp control.exe, start apache and mysql, click the admin button in apache to enter the web page, click php.info(); check whether there is the following information: If there is this information, it means that xdebug is installed successfully. (2) Open cmd and enter d:\xampp\php\php.exe -m (the previous path is the path you installed), check whether the following information appears:
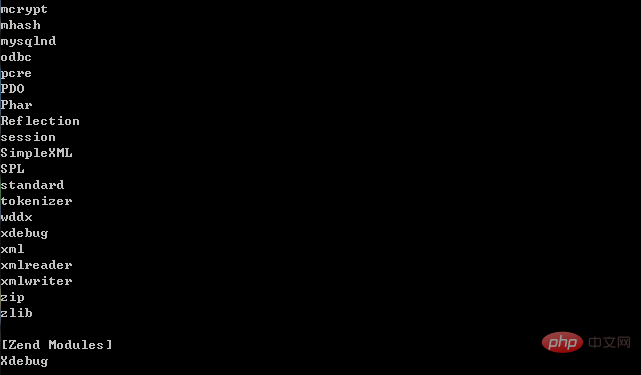 ##If the last two lines of information appear, the installation is successful.
Related recommendations: "
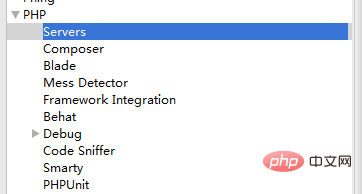
PhpStorm Usage TutorialOpen the settings in phpstorm, configure as shown below:
##Then open the setting and configure it as shown below: 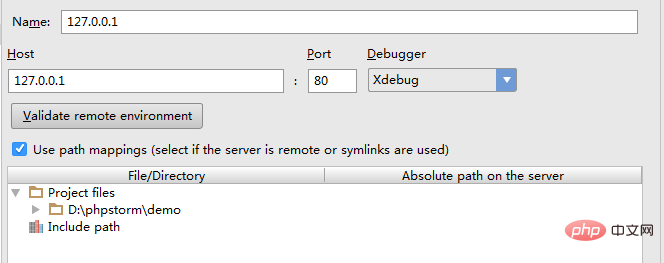
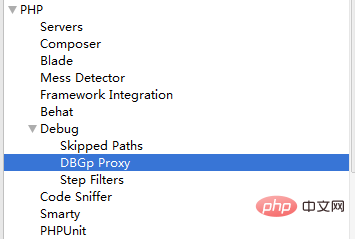
4. Install chrome browser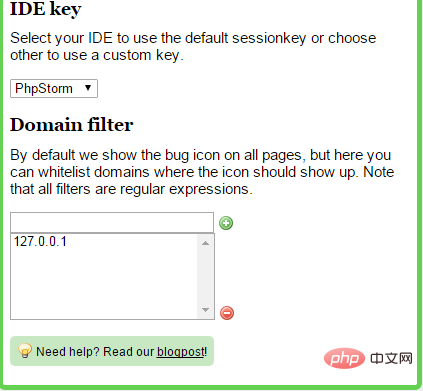
5. After restarting apache, write a php small program in phpstorm, and then click  this icon to change Turn on monitoring for
 6.
6.

Add start url as shown below: 
The demo is the name of my project, and demo.php is the name of the program that needs to be debugged. 
Click the fix button to enter the next interface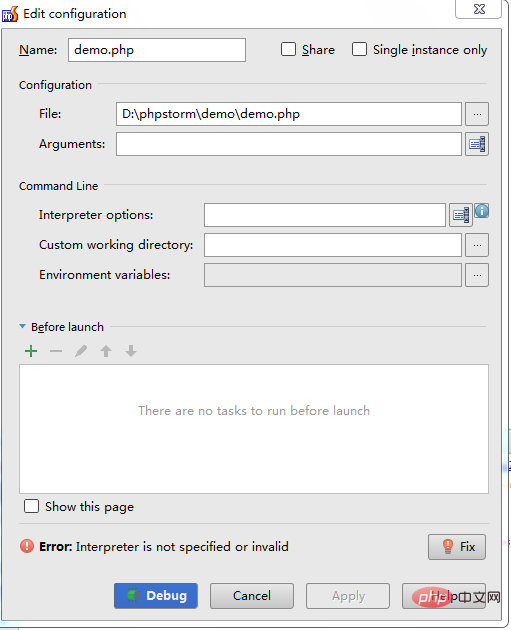
Click to add button to select other local.
After confirmation, return to the home page
The above is the detailed content of How to configure phpstorm to xampp. For more information, please follow other related articles on the PHP Chinese website!


