Home >Database >Mysql Tutorial >Introduction to mysql tuning
Introduction to mysql tuning
- 藏色散人forward
- 2019-05-16 09:17:412285browse
1 Introduction
Let’s not talk about the frequency of the CPU, the size of the memory (this is as important as the index, but it is not the content of this article), and the seek time of the hard disk. Thinking of mysql tuning, you must at least know the explain execution plan, slow sql logs, old profile commands, new performance_schema performance view and related tables of current transaction and memory usage information in information_schema, and show engine innodb status Diagnostic information, as well as some tps, qps, and iops indicators in metrix. (Related recommendation: "MySQL Tutorial")
The above are some tools prepared for tuning, and the database will provide many large and small functions for high availability, the big ones are: replication , group replication, partition, file link: that is, log logs and data files can be placed on different hard disks respectively. Small ones include: calculating columns, calculating hash for columns, index merging, index pushdown, MRR, BKA, Loose Index and other algorithms, as well as fill factors, etc.
Of course, there are no view indexes and distributed partitioned views, and join only supports nested. This is a shortcoming of mysql. The sql server join algorithm supports three types, loop while hash, which greatly improves the speed of join. . MySQL does not come with many functions to improve performance. Others are based on experience, such as static tables. Do not use functions in subqueries. Try to turn subqueries into join queries. Non-string and blob columns are always better than other numbers. Or the time column is slow. Join |order by|group must not allow it to generate a temporary table on the hard disk. Of course, this is related to memory, narrow table and wide table design, etc. Of course, it ultimately depends on your business type.
There are two ways to start optimization, one is at runtime, that is, optimizing on the running server, and the other is during the development process. No matter which one, performance_schema will be needed.
2 Performance_schema explanation
Performance view is found in every database. SQL server is a series of memory tables starting with dm_*. And mysql is the various tables in the performance_schema library. Let’s look at the entrance tables first:
SELECT * FROM setup_timers; -- 计时定义表
select * from setup_actors; -- 那些用户需要收集信息
select * from Setup_objects; -- 那些对象需要收集信息,比如mysql表,
select * from setup_consumers; -- 那些仪器的分类需要收集
select * from setup_instruments; -- 收集仪器,每一个功能点都会有仪器的事件,开始和结束,然后开启那个仪器,就会收集那个仪器的数据
First let’s look at how to turn on performance_schema Switch:
show variables like 'performance_schema' -- 这是一个read only变量

If it is OFF, it needs to be turned on in the configuration file.
The following will introduce these entry tables one by one.
1, setup_actors table

can be collected by all users.
2,Setup_objects
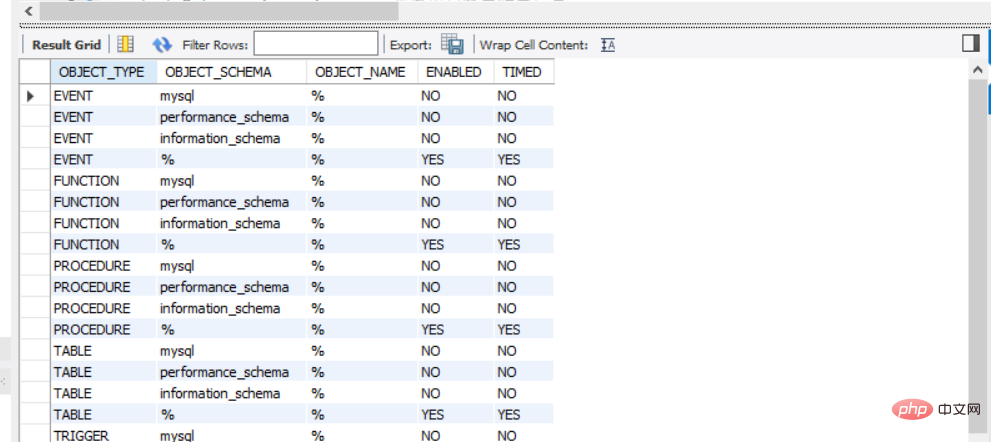
Those objects can be collected, whether they are tables or triggers, etc. As for turning off the two column controls, the enabled and timed fields are set to No, which is the case for these tables.
3 setup_consumers
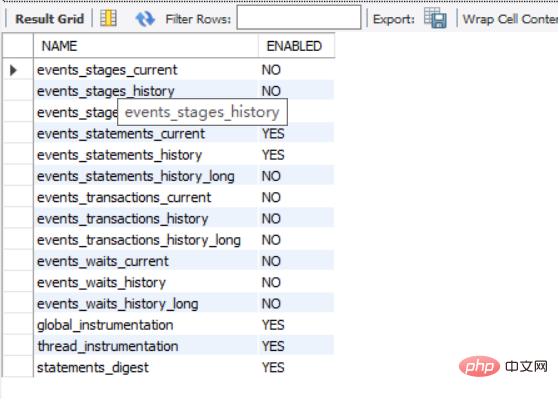
Classification of events, stages are steps, and a statement in the server The execution process steps and results are the same as profile. The profile method is not recommended because it will be removed later. Transaction is the event collection of the transaction, etc.
4 setup_instruments
This is the main event monitoring instrument, as follows:
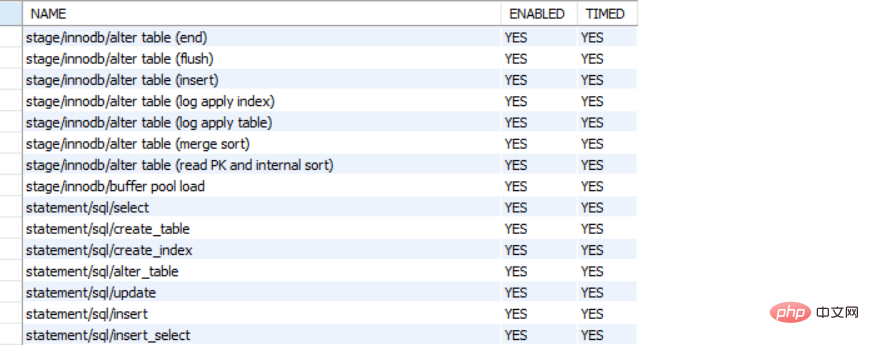
5 The last step is setup_timers, which is used together with performance_timers to define the time types of those instrument categories, as follows:
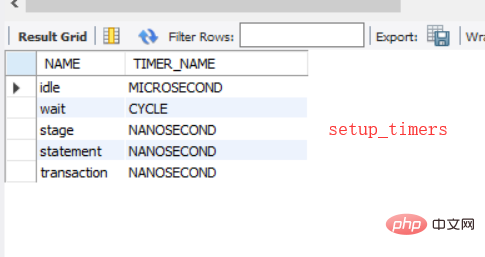
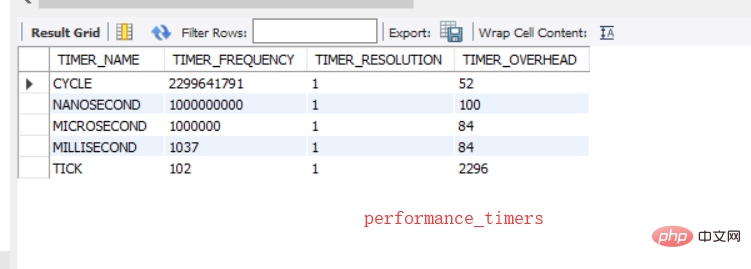
CYCLE: cpu clock, TIMER_FREQUENCY is how many seconds there are, TIMER_RESOLUTION It is how much it increases each time, and finally how often it is obtained.
Three uses performance_schema to obtain priorofile data
Open the relevant instrument:
Let’s look at the above instrument classification table The information in setup_consumers, and the rows about stage are all NO, then we need to change it to YES. At the same time, we need to get the information in the statements monitoring table, so we also need to turn on statements:
UPDATE setup_consumers SET ENABLED = 'YES'
       WHERE NAME LIKE '%stage%';
UPDATE setup_consumers SET ENABLED = 'YES'
WHERE NAME LIKE '%statements%';
Then turn on the stage instrument
UPDATE performance_schema.setup_instruments SET ENABLED = 'YES', TIMED = 'YES'
       WHERE NAME LIKE '%stage/%';   -- 开启所有执行步骤的监控
UPDATE performance_schema.setup_instruments SET ENABLED = 'YES', TIMED = 'YES'
WHERE NAME LIKE '%statement/%';
The execution is based on sql
select * from quartz.TestOne
Query the queryid of this statement:
SELECT EVENT_ID, TRUNCATE(TIMER_WAIT/1000000000000,6) as Duration, SQL_TEXT
       FROM performance_schema.events_statements_history_long WHERE SQL_TEXT like '%quartz%';

那么id就是509
然后执行性能监控表:
SELECT event_name AS Stage, TRUNCATE(TIMER_WAIT/1000000000000,6) AS Duration
       FROM performance_schema.events_stages_history_long WHERE NESTING_EVENT_ID=509
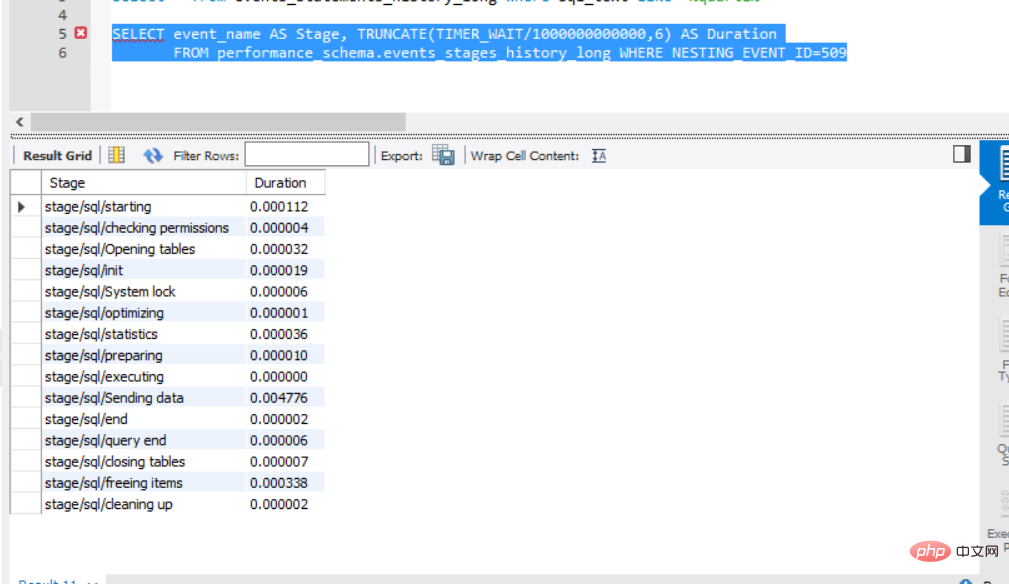
内容和老版本的profile结果一样。
主要看下stage/sql/Sending data这一行,这一行是主要io相关的事件,一般情况下,sql慢了,而这一行数值比较大,那肯定硬盘读数据慢了或者有锁冲突。
那么就是用error log,有死锁,mysql会将死锁信息打入error日志,show engine innodb status只是全局的一些信息,如果要想看详细的再去监控对应的instrument。
而且目前mysql8多支持NOWAIT和skiplocked两个语句,用法还是select.. from 表明 for update/for nowait等,非常灵活的解决了死锁的处理方式,当然你也可以让其事务隔离级别为脏读级别,但是并不能解决更多的业务类型,设置死锁超时也是一个可行的办法。
The above is the detailed content of Introduction to mysql tuning. For more information, please follow other related articles on the PHP Chinese website!

