Home >Backend Development >PHP Tutorial >PHP program running performance analysis (graphics and text)
PHP program running performance analysis (graphics and text)
- 不言forward
- 2019-04-01 10:17:583761browse
The content of this article is about PHP program running performance analysis (pictures and texts). It has certain reference value. Friends in need can refer to it. I hope it will be helpful to you. .
After using xdebug, php can configure xdebug related configurations and generate running logs.
Configure in php.ini:
- xdebug.profiler_enable = 1
- xdebug.profiler_enable_trigger = 1
- xdebug.profiler_output_name = cachegrind. out.%t.%p
- xdebug.profiler_output_dir ="d:/xdebug/"
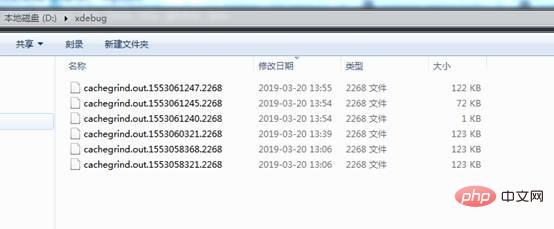
In this way, the log file will be generated to the d:/xdebug/ directory:

Every time php is executed, a corresponding log file will be generated. There used to be a tool called WinCacheGrind that could be used to analyze this kind of log, but WinCacheGrind was no longer maintained in 2015. The latest version is 1.0.0.14, which only supports xdebug2. When you open the log file, an error will be reported: "Cannot find target ".
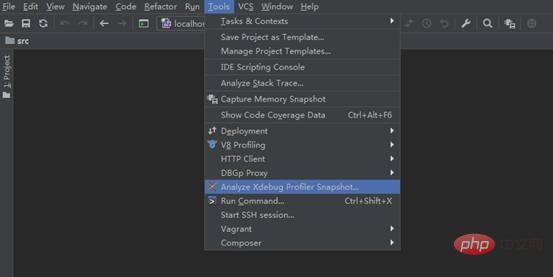
In fact, the powerful phpstorm comes with the function of performance log analysis. Open Tools->Analyze Xdebug Profiler Snapshot..

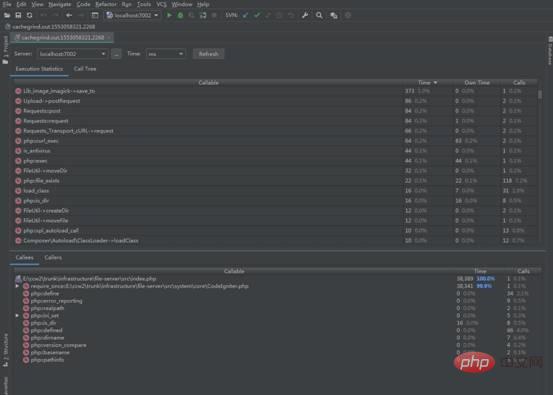
and then select D: After opening the log file under \xdebug, you can see the tree relationship of function calls and the execution time of each function

In this way, you can find out which one Function execution is time-consuming.
【Related recommendations: PHP video tutorial】
The above is the detailed content of PHP program running performance analysis (graphics and text). For more information, please follow other related articles on the PHP Chinese website!

