
Home >Web Front-end >JS Tutorial >How to use Arcgis to draw lines and areas and calculate their size?
How to use Arcgis to draw lines and areas and calculate their size?

- 青灯夜游forward
- 2018-11-10 16:06:268421browse
The content of this article is to introduce how to use Arcgis to draw lines and surfaces and calculate their sizes? It has certain reference value. Friends in need can refer to it. I hope it will be helpful to you.
In the process of map development using Arcgis API for JavaScript, drawing lines and pictures on the map is a frequently used function. This article mainly introduces this function.
This article is applicable to Arcgis API version: Arcgis API for JS 4.x or above.
Solution analysis:
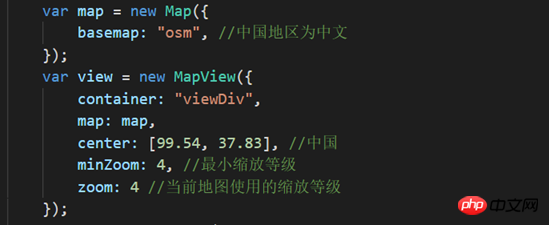
1. First, map and mapView (2D map) must be initialized;
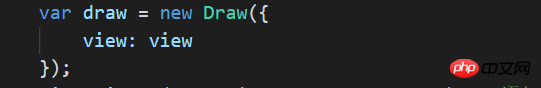
2 , and then use Draw to draw lines and perform screen operations;
3. Finally, add the lines and surfaces to Graphic to complete the operation.
Steps
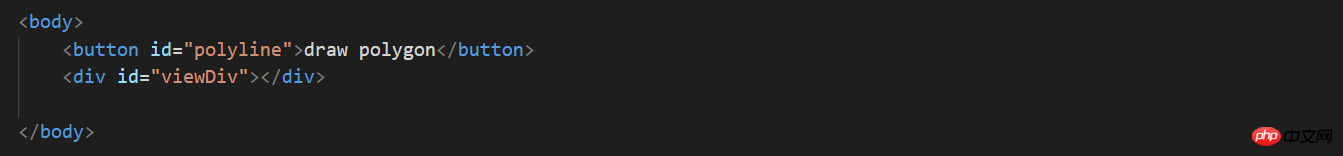
#1. First, set the container for map in html.

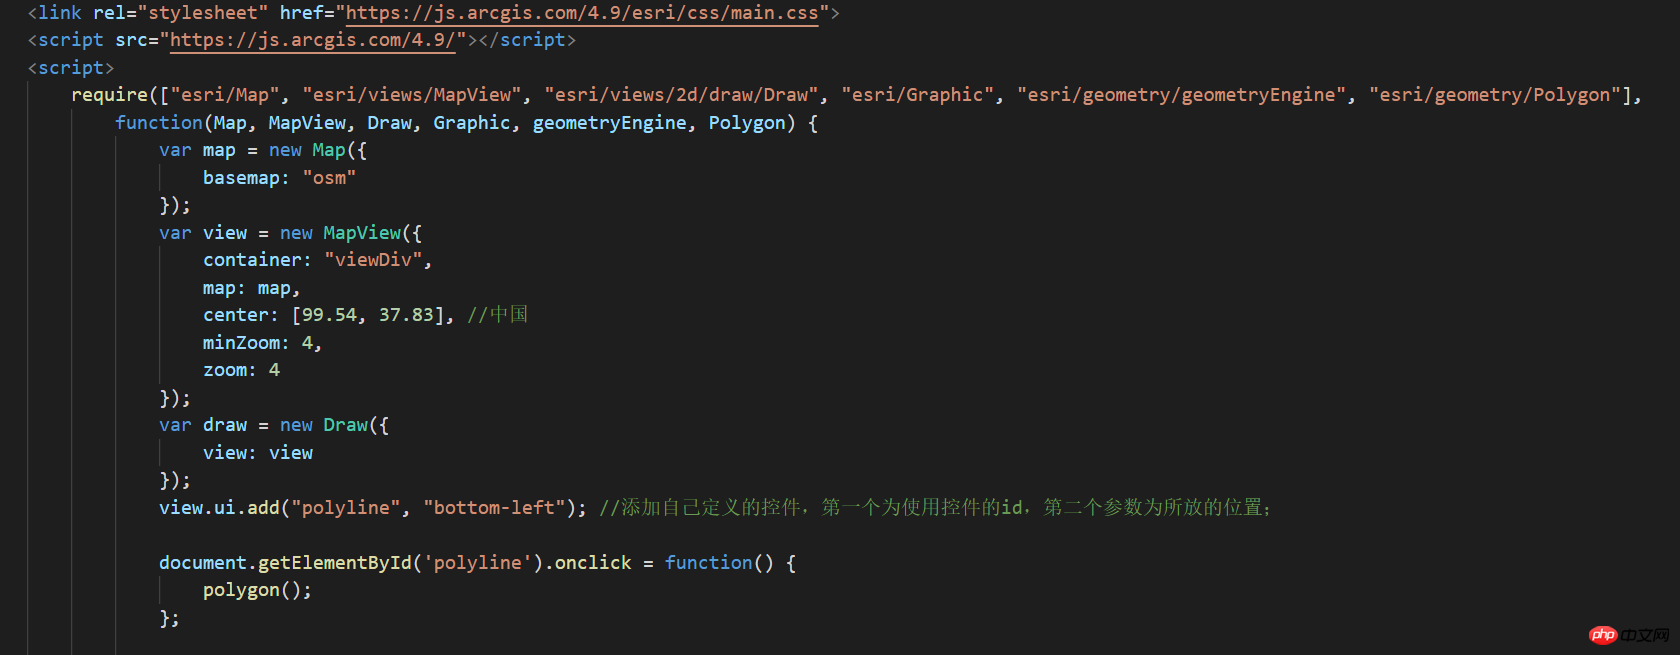
2. Initialize map and mapView;
3 , you need to use a class when drawing lines or pictures: Draw;
4. In the process of drawing the picture, you need to specify the coordinate reference to be used. Department: spatialReference;
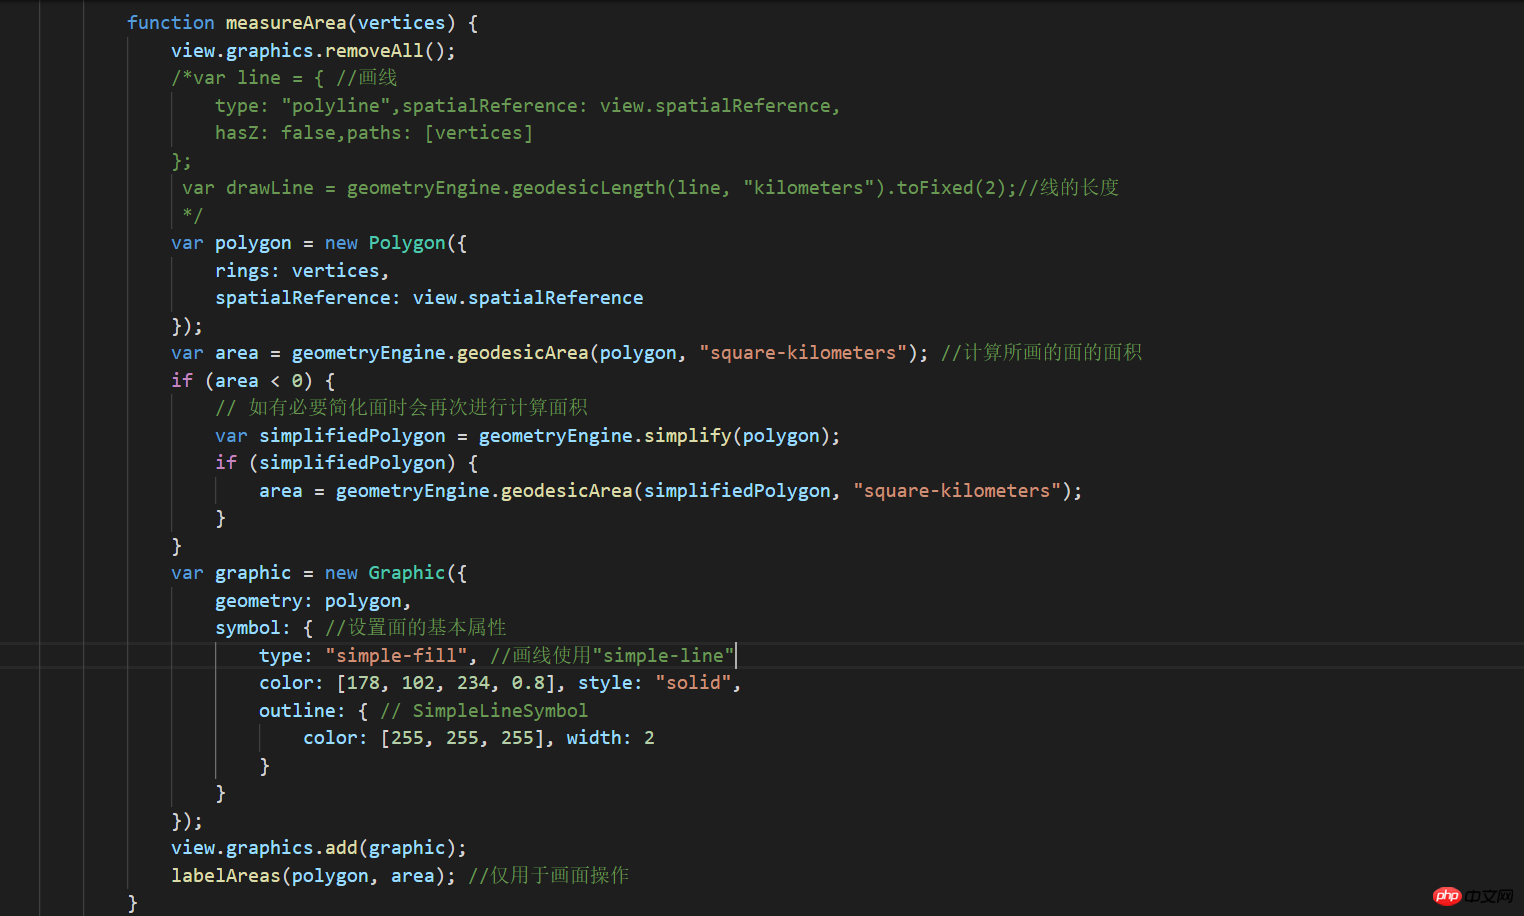
Start screen geometryEngine, calculate the size of the surface:
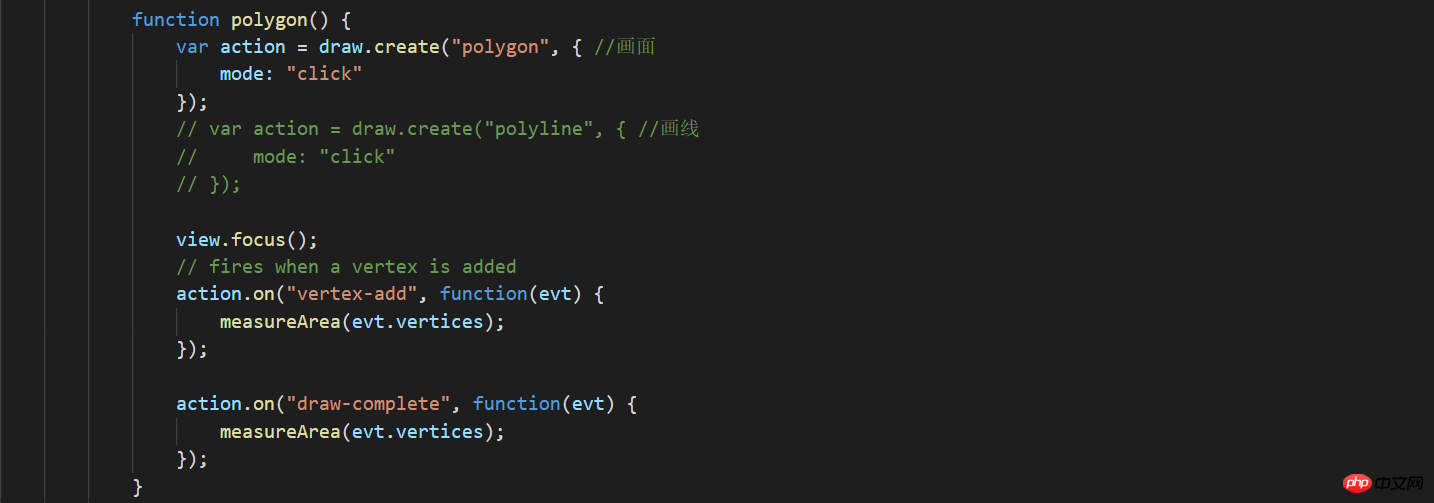
## html part:
JS part:
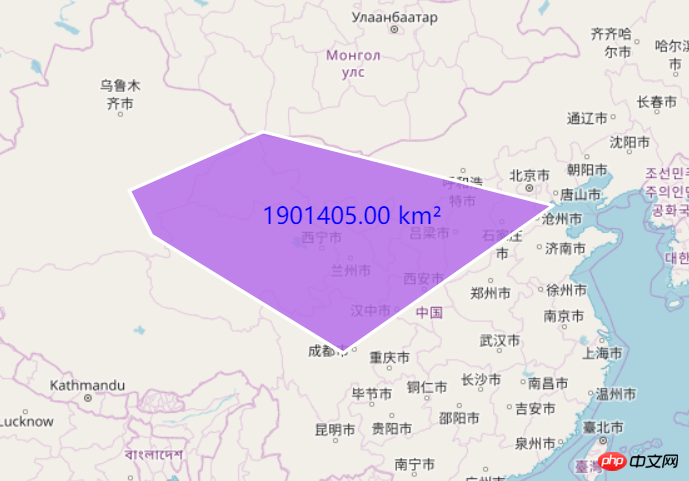
 ## Line drawing effect display:
 Because the logic of line drawing and picture is the same Yes, it’s just that some values are different, so I won’t go into more detail.
Let me say a few more words. Although I have been talking about drawing lines and pictures, in fact draw.create(drawAction,drawOption?); can also draw other shapes;
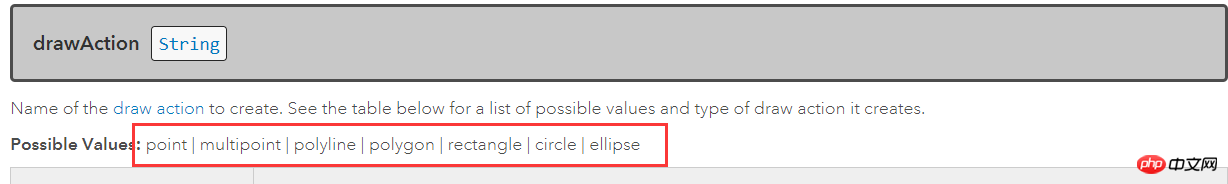 All those in the red box can be drawn You can draw points/multipoints/lines/surfaces/rectangles/circles/ellipses, and there are quite a lot of styles.
<br>drawOption is an optional parameter and does not need to be written. Judging from the official website, drawOption currently only has one attribute mode, and mode has three values: hybrid, freehand, and click.
| You can click or drag dynamically to generate the specified graphics. Currently supported graphics are polyline and polygon. | <br> |
| Specifies that only dragging actions can generate graphics (imagine Hold down the left mouse button and don't let go before dragging.). Currently supported graphics are polyline and polygon. | |
| Click to generate the specified graphic. Works with all currently supported graphics. |
The above is the detailed content of How to use Arcgis to draw lines and areas and calculate their size?. For more information, please follow other related articles on the PHP Chinese website!
Related articles
See more- An in-depth analysis of the Bootstrap list group component
- Detailed explanation of JavaScript function currying
- Complete example of JS password generation and strength detection (with demo source code download)
- Angularjs integrates WeChat UI (weui)
- How to quickly switch between Traditional Chinese and Simplified Chinese with JavaScript and the trick for websites to support switching between Simplified and Traditional Chinese_javascript skills