Home >Operation and Maintenance >Linux Operation and Maintenance >How to determine the cause of 100% CPU usage based on querying abnormal time nodes and connections
How to determine the cause of 100% CPU usage based on querying abnormal time nodes and connections
- 坏嘻嘻Original
- 2018-09-28 15:30:403510browse
This article introduces how to determine the cause of 100% CPU usage based on querying abnormal time nodes and connections, and focuses on the specific steps. The content of this article is compact, and I hope everyone can gain something.
Troubleshoot Linux instance abnormal CPU usage 100%
When using an ECS instance, you may encounter abnormal CPU usage and the CPU usage is as high as 100%. Moreover, the specific processes consuming CPU resources cannot be queried through commands such as top and htop. This article introduces three key factors for troubleshooting abnormal CPU usage, and determines the cause based on querying the abnormal time nodes and connections.
View ECS instance monitoring data
Log in to the ECS management console.
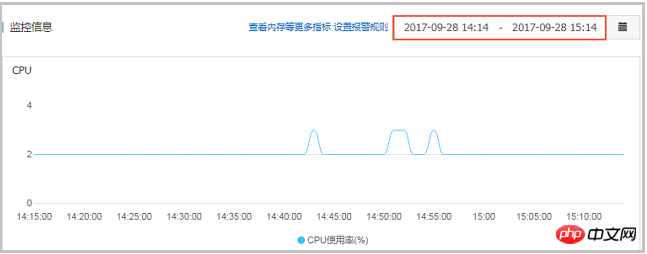
Find the exception instance and click the instance name. Query the instance CPU monitoring data in the CPU monitoring information on the instance details page.

Check the system command modification record
Connect remotely and log in to the Linux instance.
Execute the following command to check whether the system command has been modified recently.
stat /usr/bin/top
 stat /bin/ps
Check whether the change time of the system command matches the time point when the CPU usage reaches 100%.
Execute rpm to verify whether the system command has been modified. Under normal circumstances, you should not be able to see the modification information.
 rpm -Vf /bin/ps
 rpm -Vf /usr/bin/top
Check the external connection of the instance
Execute the command iftop -i eth1 -n -P to check whether the current instance is connected to the abnormal domain name, such as crypto-pool.fr in the example.

The above is the detailed content of How to determine the cause of 100% CPU usage based on querying abnormal time nodes and connections. For more information, please follow other related articles on the PHP Chinese website!

